supervisorctl logs viewer and Web UI
This blogs post brings light on how to stream logs from supervisor to Logdy UI.
Logdy is a versatile DevOps tool designed to enhance productivity in the terminal. Operating under the UNIX philosophy, Logdy is a single-binary tool that requires no installations, deployments, or compilations. It works locally, ensuring security, and can be seamlessly integrated into the PATH alongside other familiar commands like grep, awk, sed, and jq. It is particularly beneficial for professionals such as software engineers, game developers, site reliability engineers, sys admins, and data scientists who frequently work with terminal logs or outputs.
Logdy records the output of processes, whether from standard output or a file and directs it to a web UI. The web UI served on a specific port by Logdy, provides a reactive, low-latency application for browsing and searching through logs. It supports various use cases, such as tailing log files, integrating with applications (e.g., node.js, Python scripts, Go programs, or anything else that produces standard output), and tools like kubectl, docker logs etc.
One notable feature is its hackability with TypeScript, allowing users to filter, parse, and transform log messages by writing TypeScript code directly within the browser. This hackability provides flexibility to express custom logic without delving into the intricacies of other command-line tools. Overall, Logdy offers a convenient and efficient solution for managing and analyzing terminal logs.
What is supervisor?
Supervisor is a powerful process control system for UNIX-like operating systems, designed to manage and monitor long-running processes. It simplifies the management of background services and ensures that they are automatically restarted if they fail, providing high reliability and availability for critical applications.
What is supervisorctl?
Supervisorctl is a command-line client tool that is part of the Supervisor system, which is a process control system for UNIX-like operating systems. Supervisor is designed to manage and monitor processes, particularly long-running background processes, ensuring they are started at boot and remain running. Here's a more detailed explanation of Supervisorctl and its role within the Supervisor system:
How Supervisorctl Works
Supervisorctl interacts with the Supervisor daemon (supervisord), which is the main process responsible for controlling all the child processes. The daemon reads configurations from a file, typically located at /etc/supervisor/supervisord.conf, and then manages the defined processes based on this configuration.
Common Commands
supervisorctl status: Displays the status of all processes managed by Supervisor.
supervisorctl start <process>: Starts a specified process.
supervisorctl stop <process>: Stops a specified process.
supervisorctl restart <process>: Restarts a specified process.
supervisorctl tail -f <process>: Tails the log file of a specified process, showing real-time log output.
Use Cases
- Web Servers: Managing web servers like Nginx or Apache, ensuring they restart automatically if they crash.
- Background Tasks: Running and monitoring background tasks such as Celery workers in a distributed task queue system.
- Database Servers: Ensuring that database servers like MySQL or PostgreSQL remain up and running.
Accessing Supervisorctl Logs
Supervisor aggregates stdout and stderr output from all managed processes into centralized log files. There are two ways to access the logs of a supervisor process
Using Supervisorctl Command-Line Interface
Supervisorctl allows you to view logs directly from the command line. Here are some useful commands:
Tail the Log of a Specific Process:
supervisorctl tail <process-name>This command shows the last few lines of the stdout log for the specified process.
Tail the Log Continuously:
supervisorctl tail -f <process-name>Adding the -f option (follow) allows you to see the log output in real-time as it gets written.
Tail the Stderr Log:
supervisorctl tail -f <process-name> stderrThis command shows the stderr log, which is useful for debugging errors.
Directly Accessing Log Files
Supervisor stores logs in log files specified in the configuration file. You can access these log files directly using standard command-line tools.
Locate Log Files: The log file locations are defined in your Supervisor configuration (/etc/supervisor/supervisord.conf or individual process configuration files). Example configuration for a process might look like:
[program:myapp]
command=/path/to/myapp
autostart=true
autorestart=true
stderr_logfile=/var/log/myapp.err.log
stdout_logfile=/var/log/myapp.out.log
View Log Files with cat:
cat /var/log/myapp.out.logcat /var/log/myapp.err.log Real-Time Viewing with tail:
tail -f /var/log/myapp.out.logtail -f /var/log/myapp.err.log
Setting Up a Web UI for Supervisorctl
Logdy installation
Naviagate to docs for instructions on how to install Logdy. You can download a precompiled library, install using script or homebrew, lastly you can compile Logdy yourself.
As mentioned above, you can pair supervisor with Logdy in a single line
$ supervisorctl tail <process-name> | logdySimilarly you can read the file directly to Logdy with this command
$ cat /var/log/myapp.out.log | logdyThe command above will stream entire file to Logdy where you can browse it by reloading the buffer.
Enter Logdy web UI
Visit the address provided in the console output after starting Logdy, by default it should be http://localhost:8080
Display columns and filters
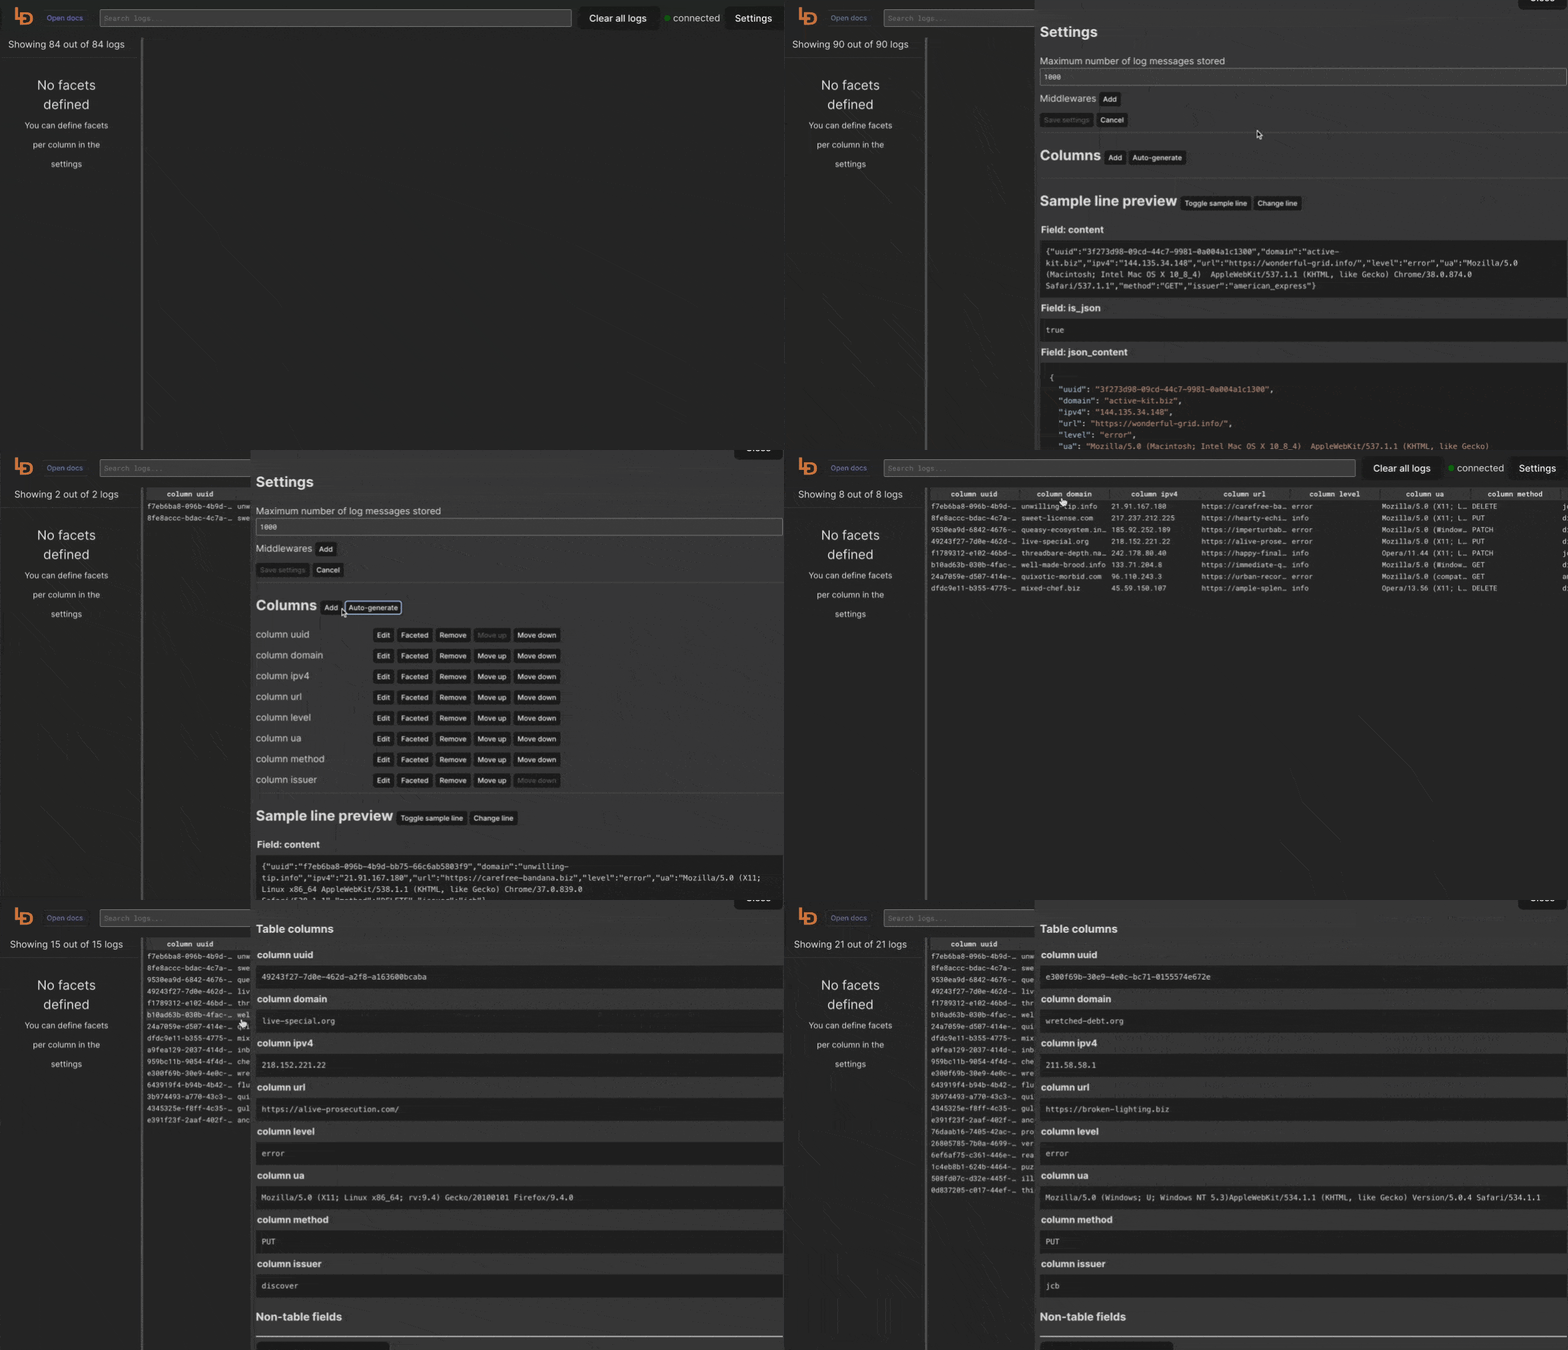
Logdy makes parsing and column selection a breeze. Use a built in "autogenerate" feature to generate columns based on JSON object present. Then you can make any adjustments and customizations. Based on the columns you can also emit facets or use another great feature to generate those automatically.
With a JSON object in place, you can use Auto-generated columns together with Faceted columns.

Here are a few blog posts that show case a magnitude of Logdy applications:
