Kubernetes logs web UI with Logdy
What's the challenge?
Reading Kubernetes logs can present challenges due to the distributed and dynamic nature of containerized environments. One difficulty is the sheer volume of logs generated by numerous containers and pods, making it challenging to pinpoint specific issues. Additionally, logs may be spread across multiple nodes, making centralized analysis complex. Understanding container-specific logging formats and troubleshooting issues related to service interactions further adds to the complexity, requiring familiarity with Kubernetes architecture and logging conventions.
kubectl
Kubectl serves as the command-line interface (CLI) tool designed for communication with Kubernetes clusters. This robust and flexible utility empowers users to oversee and govern Kubernetes clusters through command execution on the Kubernetes API server. With kubectl, users can undertake a range of tasks, including deploying applications, inspecting and overseeing cluster resources, examining pod logs, adjusting application scales, and more.
kubectl logs a primer
kubectl logs is a command in the Kubernetes command-line interface (kubectl) that allows you to retrieve and view the logs generated by containers running inside a pod. Here's a quick primer on using kubectl logs:
$ kubectl logs <pod-name>To stream the logs in real-time, use the -f option:
$ kubectl logs -f <pod-name>If a pod has multiple containers, specify the container name
$ kubectl logs <pod-name> -c <container-name>Include timestamps in the log output:
$ kubectl logs <pod-name> --timestampsLimit the number of lines displayed using the --tail option:
$ kubectl logs <pod-name> --tail=<number>Retrieve logs from the previous instance of a container:
$ kubectl logs <pod-name> --previousSpecify the namespace using -n or --namespace:
$ kubectl logs -n <namespace> <pod-name>Displaying Logs for a Specific Container in a Deployment:
$ kubectl logs -l app=<deployment-name> -c <container-name>Redirect logs to a file:
$ kubectl logs <pod-name> > logs.txtCombine multiple options:
kubectl -n <namespace> logs -f deployment/<app-name> --all-containers=true --since=10mTools that help reading k8s logs
- kubetail - Bash script that enables you to aggregate (tail/follow) logs from multiple pods into one stream. This is the same as running "kubectl logs -f " but for multiple pods.
- kail - Kubernetes tail. Streams logs from all containers of all matched pods. Match pods by service, replicaset, deployment, and others. Adjusts to a changing cluster - pods are added and removed from logging as they fall in or out of the selection.
- stern - Stern allows you to tail multiple pods on Kubernetes and multiple containers within the pod. Each result is color coded for quicker debugging.
Using Logdy to view Kubernetes logs in a web ui
Logdy is a multipurpose CLI tool that can read any input lines and generate a slick web UI in the browser, on the fly, with a minimal setup.
TIP
Not familiar with Logdy? Read more about it.
$ kubectl logs -f | logdyYou can also run Logdy with any of the k8s logs specific tools
$ kubetail app2 -c container1 -c container2 | logdy
$ kail --rs workers
$ stern . -n kube-system --tail 0 | logdy
Logdy follows UNIX philosophy, whatever is produced as an output, can be consumed by Logdy.
Enter Logdy web UI
Visit the address provided in the console output after starting Logdy, by default it should be http://localhost:8080
Display columns and filters
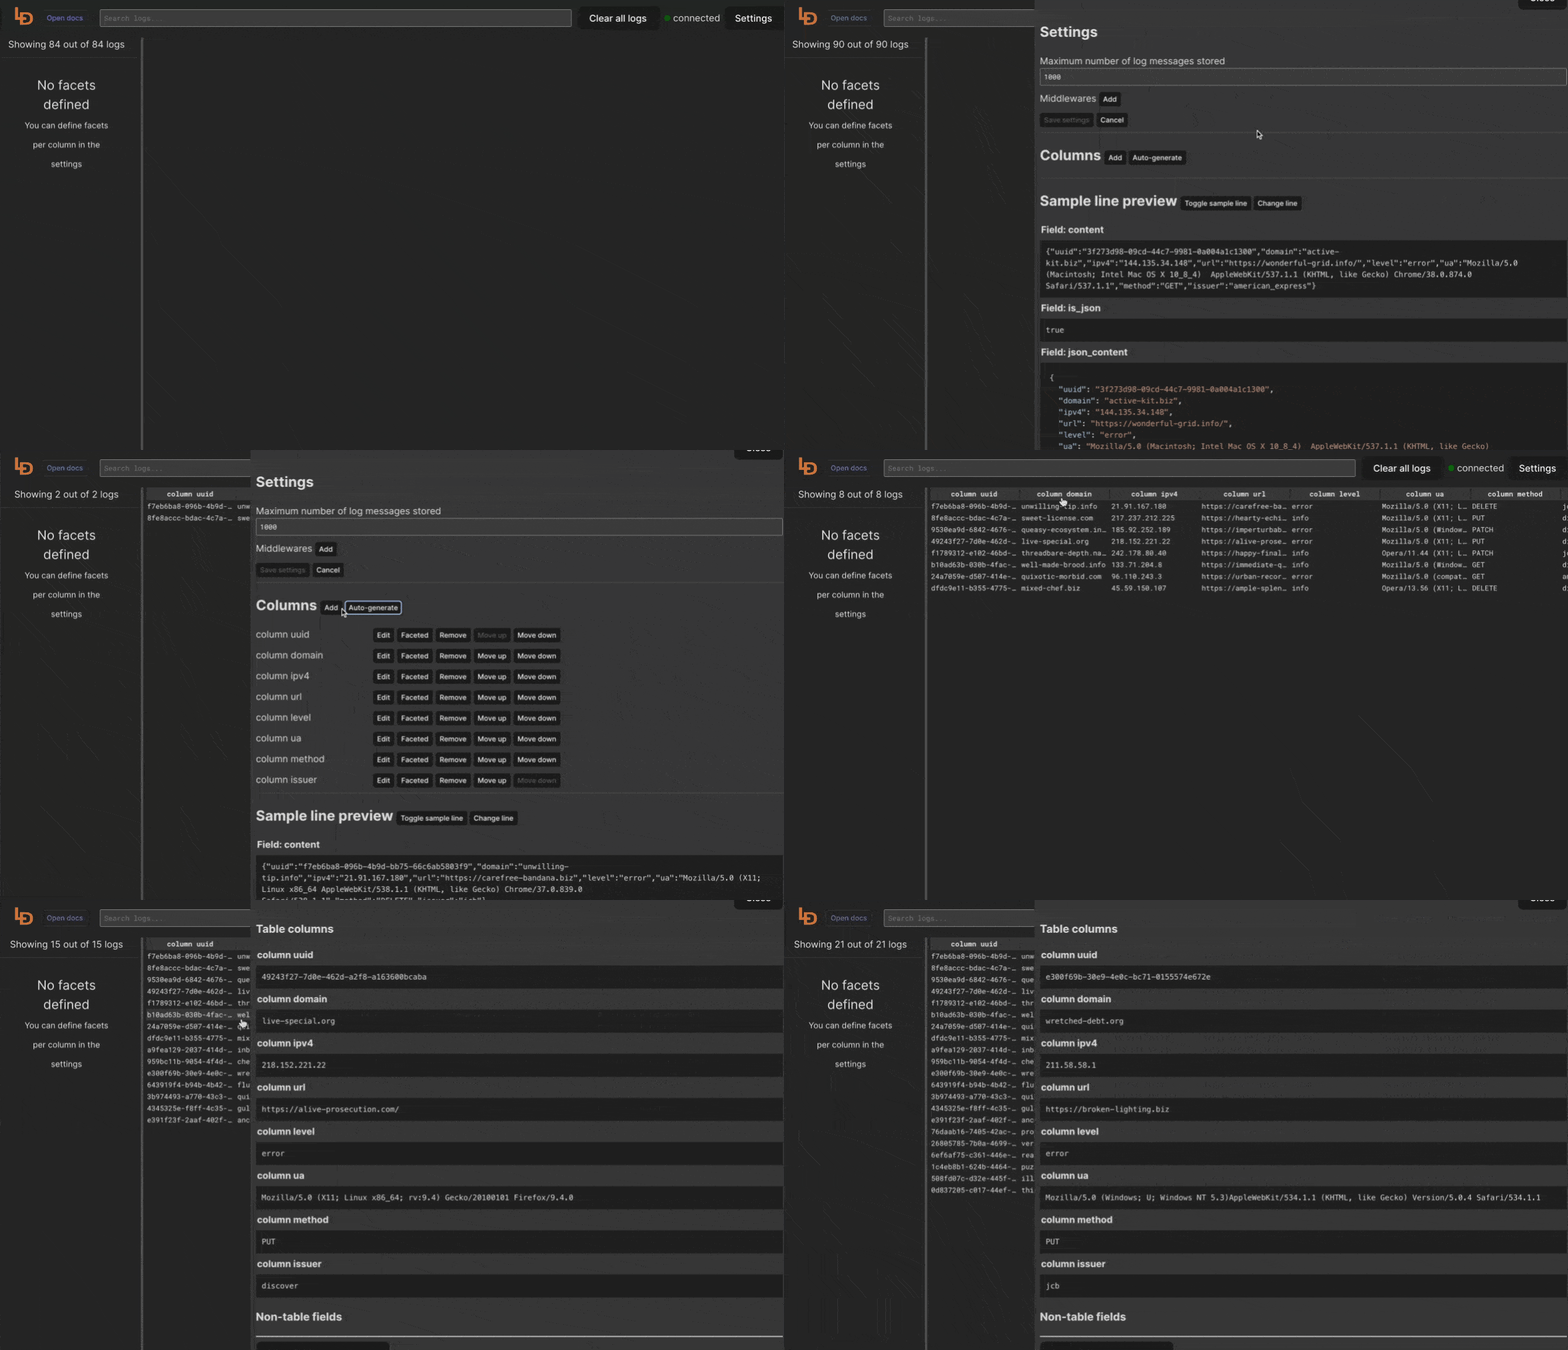
Logdy makes parsing and column selection a breeze. Use a built in "autogenerate" feature to generate columns based on JSON object present. Then you can make any adjustments and customizations. Based on the columns you can also emit facets or use another great feature to generate those automatically.
With a JSON object in place, you can use Auto-generated columns together with Faceted columns.

