Journalctl logs web viewer with Logdy
What is journal?
In Linux, journalctl is a command-line utility that allows you to query and display messages from the journal, which is a centralized logging system provided by the systemd system and service manager. The journal collects and stores log data from various sources, including the kernel, system services, and user applications.
How to use journalctl?
TIP
Already familiar with journalctl? Jump to journalctl + Logdy = web journal viewer section
Viewing Logs
You can use journalctl to view logs in real-time or to query logs from previous sessions. To view the entire journal, you can simply run journalctl without any options.
Filtering and Querying
You can filter logs based on various criteria such as time range, specific units (services), log levels, and more. For example, journalctl -u nginx will display logs related to the Nginx service.
Output Formatting
journalctl provides various output formatting options, such as displaying logs in a concise or verbose format, as well as outputting to JSON.
Boot Logs
You can use journalctl to view logs from a specific boot session or from the current boot. For instance, journalctl -b shows logs from the current boot.
Follow Mode
You can use the -f option to follow the journal in real-time, similar to the tail -f command for traditional log files.
Here are a few examples of journalctl commands:
Display all messages from the current boot:
journalctl -bShow logs for a specific service (e.g., Nginx):
journalctl -u nginxDisplay real-time logs:
journalctl -fView logs since a specific time:
journalctl --since "2022-02-12 08:00:00"Show logs with a specific log level (e.g., error):
journalctl -p errList selectable units for which journalctl can produce logs
journalctl --field _SYSTEMD_UNITOutput logs in JSON format:
journalctl -o jsonMake sure to check the journalctl manual (man journalctl) for more options and details on using this command.
journalctl + Logdy = web journal viewer
$ journalctl -u nginx.service -f -n 1000 -o json | logdyEnter Logdy web UI
Visit the address provided in the console output after starting Logdy, by default it should be http://localhost:8080
Display columns and filters
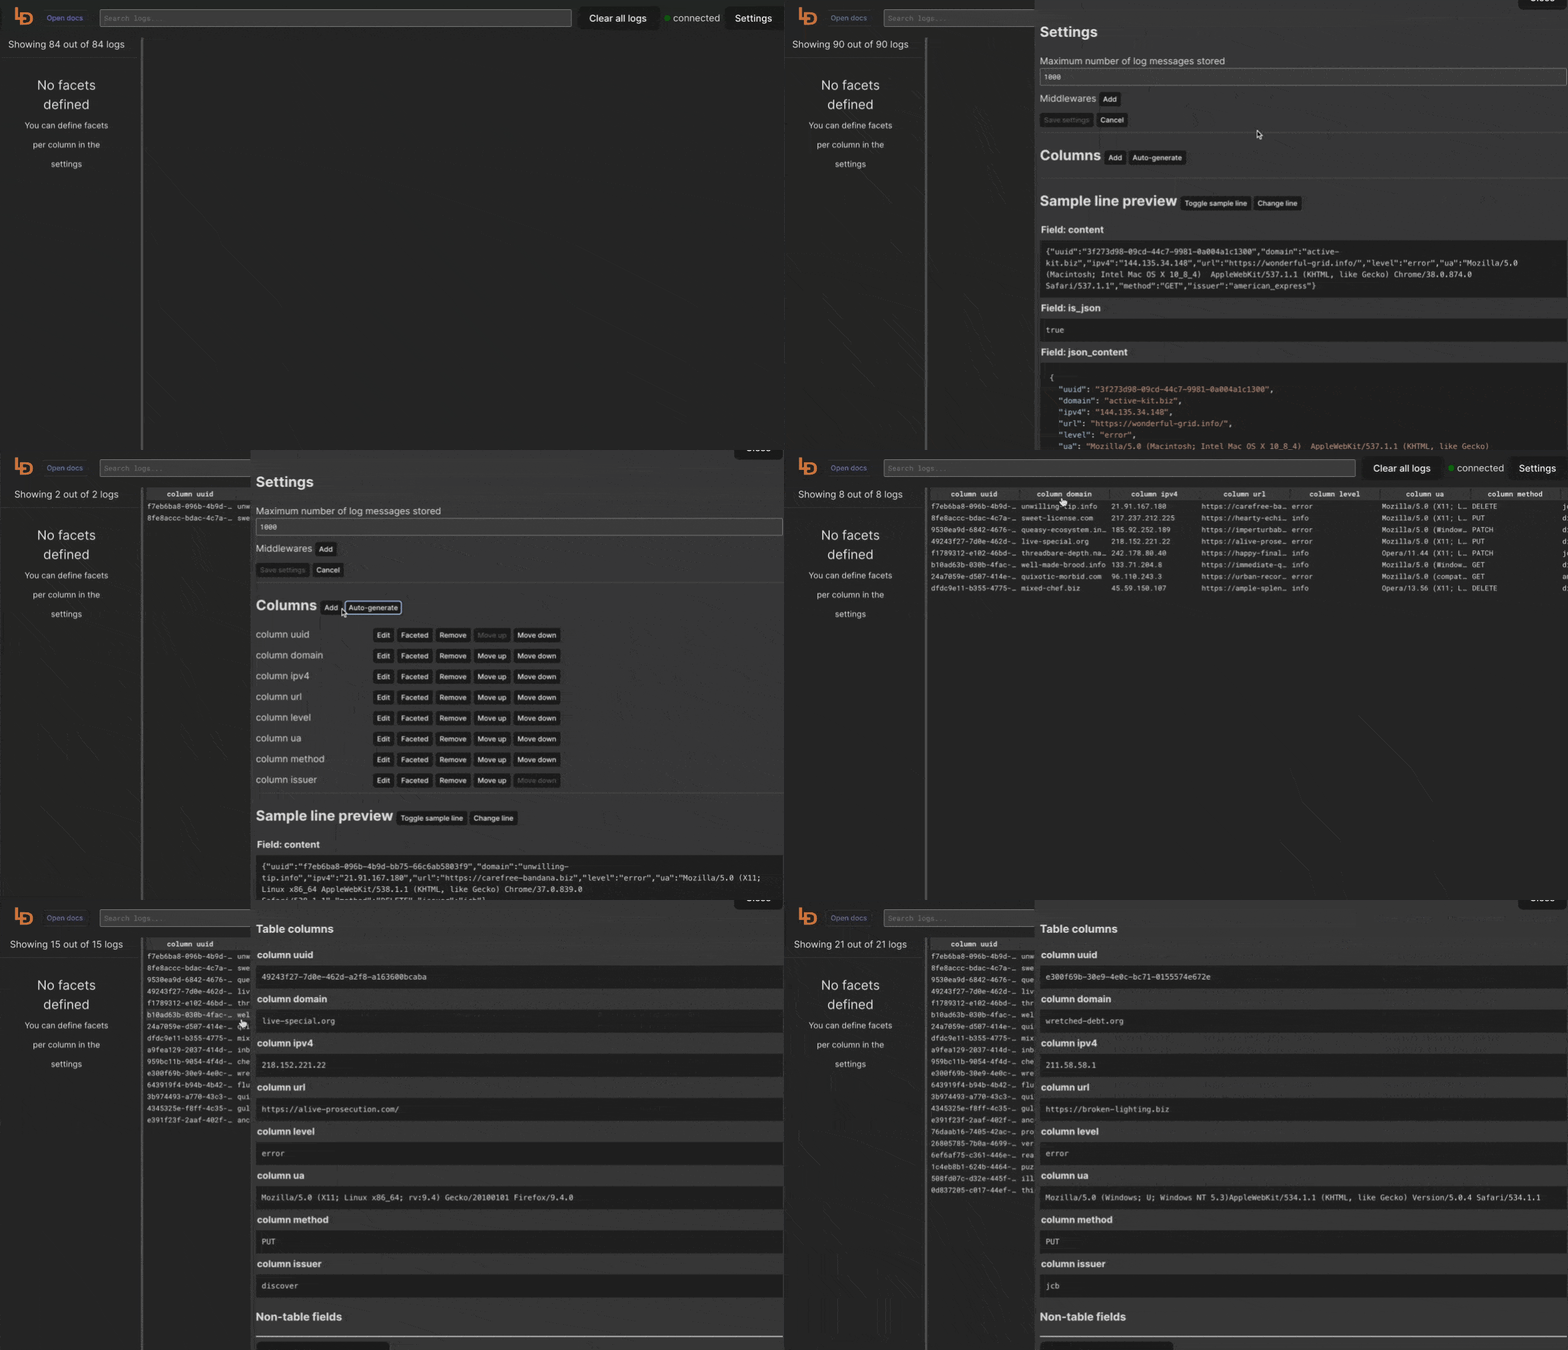
Logdy makes parsing and column selection a breeze. Use a built in "autogenerate" feature to generate columns based on JSON object present. Then you can make any adjustments and customizations. Based on the columns you can also emit facets or use another great feature to generate those automatically.
With a JSON object in place, you can use Auto-generated columns together with Faceted columns.

