Docker logs web browser UI
In this blog post, you will learn how to browse docker logs in a Logdy UI. First let's do a quick recap on Docker logs.
Docker logs recap
TIP
You can skip this section if you already know how to use Docker logs
Docker logs provide information about the running containers, allowing you to troubleshoot issues, monitor application output, and gain insights into container behavior. Here's a quick recap of Docker logs and some useful commands:
Basic command that will display all of the logs.
bash
$ docker logs [CONTAINER_ID or CONTAINER_NAME]This command will display all logs up until 3 seconds ago
bash
$ docker logs my-container --follow --since=3sThis command will display last 10 lines and will start following new lines added. This command is most similar to tail -f command.
bash
$ docker logs my-container --follow --tail=10Logs are also stored in files. If you would like to search a big amount of logs, than operating on files might be more handy.
/var/lib/docker/containers/<container_id>/<container_id>-json.logDocker logs browser UI
Logdy is an alternative to Dozzle, however Logdy can do much more, it's extensible, can parse and adapt to any format of logs being produced. In addition you can monitor multiple Docker container in a single view.
Logdy is also an alternative to hosted solutions like DataDog, Papertrail or Portainer, to name a few.
Setup logs browser for Docker with Logdy
Basic version of listening to logs from a single Docker container
bash
$ docker logs my-container --follow --tail=10 | logdyA setup that allows to listen and combine logs from multiple containers into a single stream.
bash
$ logdy socket 8123 8124bash
$ docker logs my-container1 --follow --tail=10 | logdy forward 8123
$ docker logs my-container2 --follow --tail=10 | logdy forward 8124
TIP
You can forward logs to a single port if you don't need an information from which container a specific log line is coming from. The above setup let's you see from which port a specific log line is coming from, so by assigning a container to each port, you can detect the container and display it's name in the UI
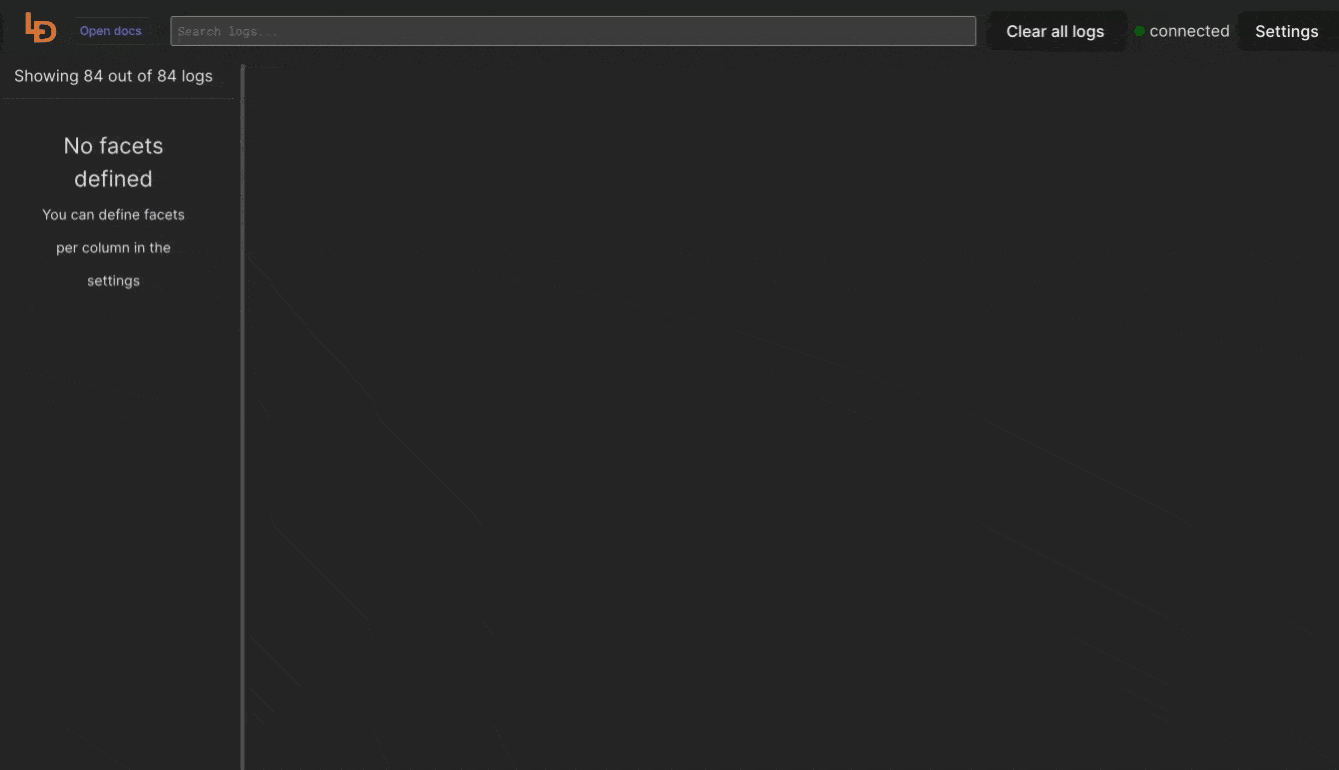
Enter Logdy web UI
Visit the address provided in the console output after starting Logdy, by default it should be http://localhost:8080
Display columns and filters
Logdy makes parsing and column selection a breeze. Use a built in "autogenerate" feature to generate columns based on JSON object present. Then you can make any adjustments and customizations. Based on the columns you can also emit facets or use another great feature to generate those automatically.
With a JSON object in place, you can use Auto-generated columns together with Faceted columns.
Build mapping for multiple containers
ts
(line: Message): CellHandler => {

    let mapping = {
        '8123': "mycontainer1",
        '8124': "mycontainer2",
    }

    return {
        text: mapping[line.origin.port],
        facets: [
            { name: "Container", value: mapping[line.origin.port] }
        ]
    }
}