Part 3: Log file compression with Zstandard VFS in SQLite + benchmark
Watch out! You're reading a series of articles
- Part 1: Log file compression with Gzip and Zstandard + benchmark
This is the first part of a series of articles diving into log files compression techniques.
- Part 2: Log file compression with SQLite + benchmark
The second part utilizes SQLite as an embeddable storage that not only provides querying capaibilites but also is able to compress the logs itself.
- (currently reading) Part 3: Log file compression with Zstandard VFS in SQLite + benchmark
The third part dives deeper into compression capabilities of SQLite using Zstandard compression algorithm.
- Part 4: Log file compression with Zstandard selective column in SQLite
The fourth part explores database level compression of specific columns within SQLite.
You can find the script that was used to seed the database with data, perform compression and run benchmarks here.
I started looking into existing solutions to compress SQLite database while retaining querying capabilities. One very perspective candidate was https://github.com/jtarchie/sqlitezstd repo which is described as:
Go sqlite VFS for using a zstd seekable compressed file.
After inspecting the repo, I decided to give it a try as it sounded promising. I didn't have any particular requirement or constraints. I definitely want to reduce the file size while retaining a reasonable query times.
How it works?
In a nutshell, the library leverage Zstd ability to seek through a compressed file without decompressing it. Paired with VFS, the library could decompress just the chunks of the DB file that are needed to satisfy the query.
TIP
If you are interested in more details, you can read author's blog post about it
As per author's LinkedIn in post:
I explored creating my compression interface. Sqlite has a virtual file system, so all file operations (create, open, read, write) are done through this interface. You've seen it before with HTTP operations.
In Go, someone created a wrapper around sqlite and the VFS interface (...)
After much Google searching and learning about compression algorithms later, I learned about zstd and its seekable implementation. It allows chunks of a file to be compressed. Other formats allow this but don't guarantee decompression speed. Zstd is fast!
To make it work we need only 2 things, first we have to compress the DB file using a zstd-seekable-format-go.
bash
go get github.com/SaveTheRbtz/zstd-seekable-format-go/cmd/zstdseek
go run github.com/SaveTheRbtz/zstd-seekable-format-go/cmd/zstdseek
    -f nginx_logs_columns.db
    -o nginx_logs_columns.db.zst
Updating the dataset
One caveat is that you cannot update the data (insert, update or remove), which means the compressed database is read-only. In order to update the data you have to do it on the uncompressed file and run the compression again. This fact disqualifies the solution described in this post for a data that is changing, however for logs storage solution, it's still great since logs are append only and you can compress the "cold" dataset once you decide it's the time to move it to a different storage tier.
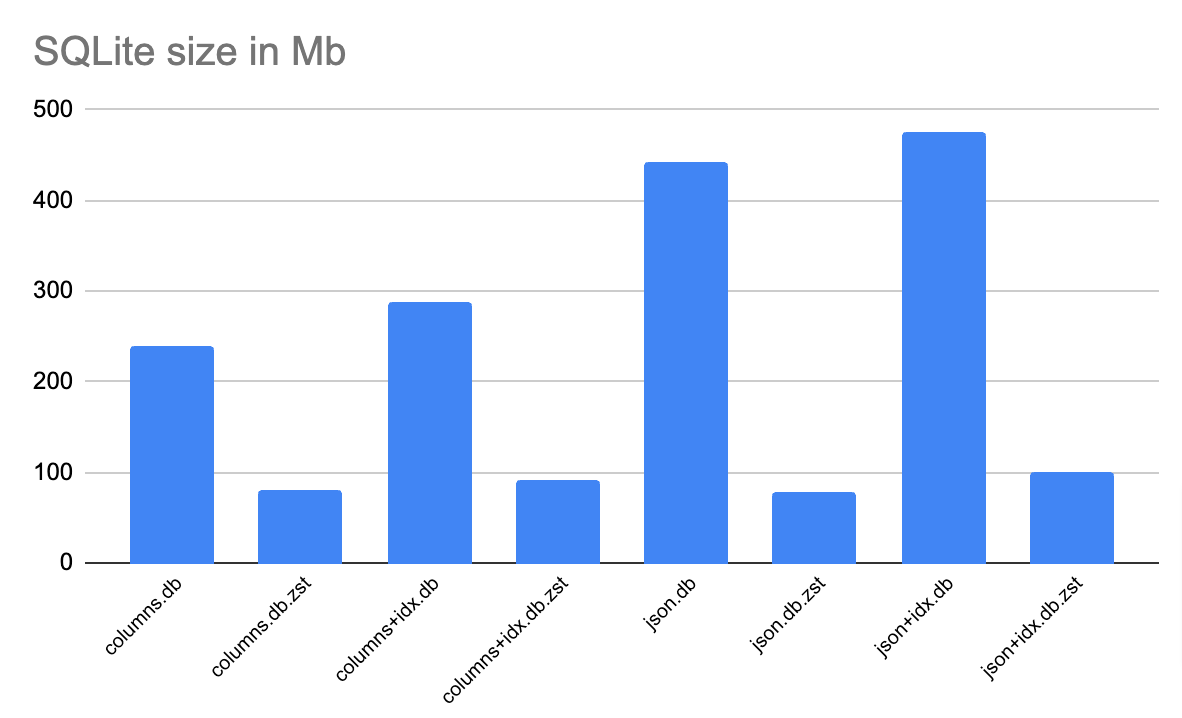
This is what I got after compressing the DB with columns (no indexes). Not bad, considering that the database is fully readable without decompressing it!
bash
240M nginx_logs_columns.db
80M nginx_logs_columns.db.zst
Then, following the readme, we need to update our driver code to use the module and that's it! Looks promising!
I tried the following steps but it turned out I was misconfiguring the SQLite database (pragma). After working out the solution with the library author we were able to overcome this, you can read more in this Github issue.
Here are the size results plotted on a chart
Conclusion
Now, we're getting somewhere, the db containing JSON along with indexes weights 100Mb which is x4.7 times less than non indexed JSON (raw file format). Indexes should give us a boost in query performance.
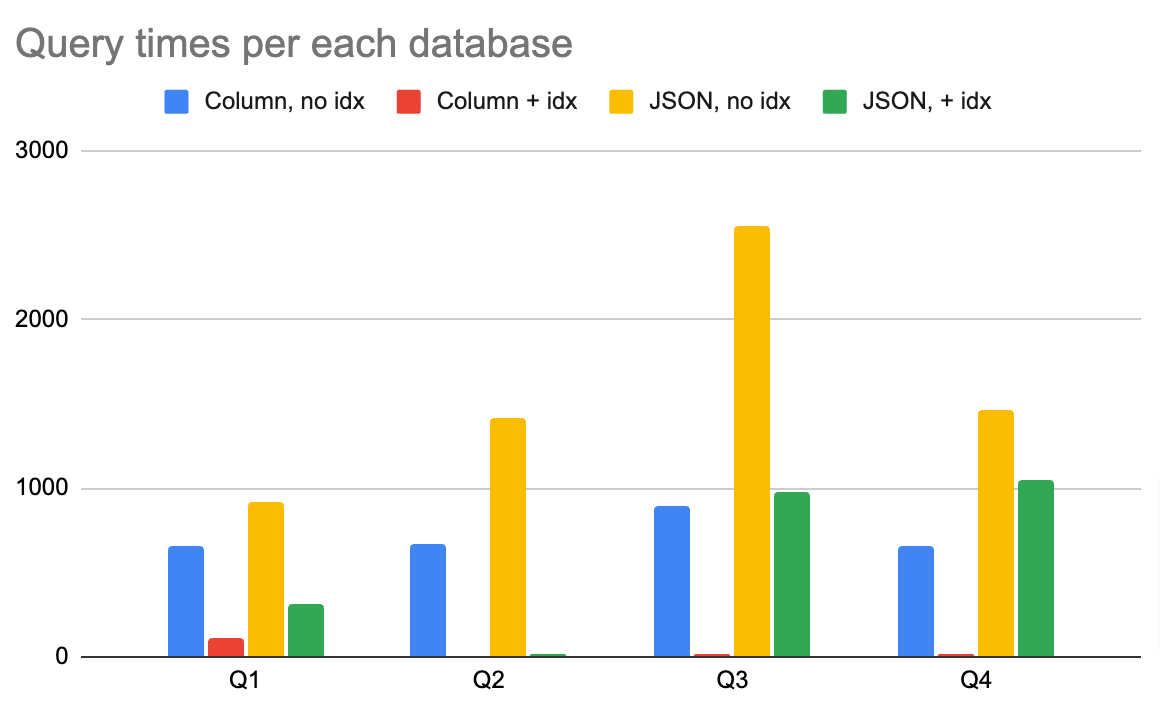
Now it's time for benchmarking queries and the results. I used the same queries as in part 2 of the series, but I'll be referencing them here.
Columns table, no indexes at all
sql
select count(*), 1 from nginx_logs;
-- uncompressed db: 36.483233ms, compressed db: 662.259175ms
-- times slower: x18.152426

select count(*), 1 from nginx_logs where status = 200;
-- uncompressed db: 57.2155ms, compressed db: 667.6155ms
-- times slower: x11.668438

select status, count(*) from nginx_logs group by status;
--uncompressed db: 172.643208ms, compressed db: 889.266275ms
-- times slower: x5.150891

select status, count(*) from nginx_logs where status = 200 group by status;
--uncompressed db: 58.791466ms, compressed db: 658.460066ms
-- times slower: x11.199926
Compressing table with columns + indexes
Next step was to add indexes and compress the database again. These are the size results:
bash
287M nginx_logs_columns.db
92M nginx_logs_columns.db.zst
Not bad! The compressed database is still under 100Mb, but we have fully queryability and indexes on top! Let's see how it performs
Columns table + indexes
sql
select count(*), 1 from nginx_logs;
--uncompressed db: 10.747633ms, compressed db: 111.024825ms
-- times slower: x10.330165

select count(*), 1 from nginx_logs where status = 200;
--uncompressed db: 2.093808ms, compressed db: 11.320358ms
-- times slower: x5.406588

select status, count(*) from nginx_logs group by status;
--uncompressed db: 3.522ms, compressed db: 13.17675ms
-- times slower: x3.741269

select status, count(*) from nginx_logs where status = 200 group by status;
--uncompressed db: 4.138524ms, compressed db: 13.189725ms
-- times slower: x3.187060
These are great results! Event on compressed database the queries are very fast and probably more than enough for log browsing/searching purposes.
Compressing table with JSON, no indexes
This is the file sizes we got after compressing the database file with JSON
bash
442M nginx_logs_json.db
78M nginx_logs_json.db.zst
And here are the query benchmark results
sql
select count(*), 1 from nginx_logs;
--uncompressed db: 107.843866ms, compressed db: 923.483883ms
-- times slower: x8.563156

select count(*), 1 from nginx_logs where json_log->'status' = 200;
--uncompressed db: 621.393666ms, compressed db: 1.418339133s
-- times slower: x2.282513

select json_log->'status', count(*) from nginx_logs group by json_log->'status';
--uncompressed db: 1.399023558s, compressed db: 2.554849775s
-- times slower: x1.826166

select json_log->'status', count(*) from nginx_logs where json_log->'status' = 200 group by json_log->'status';
--uncompressed db: 625.346883ms, compressed db: 1.465608525s
-- times slower: x2.343673
Those are not so great times, the database is not indexed, that means SQLite has to parse each and every row to extract the needed values.
Compressing table with JSON + indexes
After compressing the db with json + indexes (on virtual columns)
bash
476M nginx_logs_json.db
100M nginx_logs_json.db.zst
Query benchmark results for json + indexes
sql
select count(*), 1 from nginx_logs;
--uncompressed db: 14.106874ms, compressed db: 316.986466ms
-- times slower: x22.470355

select count(*), 1 from nginx_logs where status = 200;
--uncompressed db: 5.120316ms, compressed db: 13.815766ms
-- times slower: x2.698225

select json_log->'status', count(*) from nginx_logs group by status;
--uncompressed db: 124.631491ms, compressed db: 973.155908ms
-- times slower: x7.808267

select json_log->'status', count(*) from nginx_logs where status = 200 group by status;
--uncompressed db: 120.025808ms, compressed db: 1.05072165s
-- times slower: x8.754131
The results got better for an indexed database, this came at a cost of having a bigger size of the compressed database.
TIP
The results are highly dependent on the JSON contents and tuning of both compression and SQLite database. You can play with your own settings to find greates balance.
Benchmark conclusion
Below are the results of benchmark queries per compressed database (with and without indexes). My summary is that most effective compression is with JSON and indexes as it gives you a full flexibility on what kind of log message format you ingest as well as it provides pretty good times for query times if you're using indexes.
Compression and SQLite tuning
As mentioned above, there are still things to improve, a couple of things that comes to mind immediately are:
- Use JSONB format in SQLite, that would reduce the database size between 5-10% at least (as per official docs) and improve query times as only half of the CPU cycles are needed when querying JSONB format.
- Play with
index on expressionsin SQLite, instead of creating a virtual column you can create the query directly on the JSON column. That should yield additional space saving. - If you decide to go with a virtual column, there is no need to have that value in the JSON column (duplication), you can get rid of it.
- Perhaps a primary key is not needed, I didn't experiment with it, this would reduce the space a little bit (approx 8 megabytes for 1 million records since int primary key is a 64-bit signed integer).
However, there are more optimizations that we can apply so we could benefit database file reduction and query speed.
Both Zstandard and SQLite has ways to tweak the performance, depending on the combination they could speed up or speed down the queries. I identified the following properties I wanted to play with:
- Table with multiple columns (each column per JSON property) or table with a column containing JSON - this will impact database file mostly, improve query time but will increase the complexity as each field will have to land in it's own column. For many different log formats, that could be cumbersome.
- Indexes (added or not added) - having indexes will increase the database size but also improve query speed.
PRAGMA page_size: 4096, 16384, 65536 - This is tricky and depends on the query workload characteristics- Zstandard compression level: 1, 5, 10 - This is tricky too, the bigger the compression the more space on disk is saved, however the decompression cost could impact the query speed. The tricky part is the cost doesn't have to be neccesarily bigger, since more compressed data takes less space therefore could be read faster.
- Zstandard chunk size setting: 16:32:64, 64:128:256, 1024:2048:4096 - I guess this has something to do with the interaction of VFS and Zstandard compressed chunks.
I wanted to find the fastest solution, so I wrote a benchmark that combines all of these options, and ended up with 108 combinations which was automatically ran with a Golang script.
In the end, I identified the combination of options that achieves balance between compressed file size and query speed. This is non trivial as the more the file is compressed the faster the CPU can decompress it but there is less data to be read from the disk (IO). The results are:
For both Column and JSON table either with or without indexes the settings that got the best results:
* PRAGMA page_size = 65536;
* Zstandard compression level: 10
* Zstandard chunk size setting: 1024:2048:4096
The second best setting came out to be the one below, which also got nice results but since the compression chunking was set to lower, we observed 10-15% bigger database file size compared to the settings above.
* PRAGMA page_size = 16384;
* Zstandard compression level: 10
* Zstandard chunk size setting: 64:128:256
I hope you enjoyed this read and it will help you deciding what kind of compression capabilities SQLite has. I'm also planning to release a fourth part of the series, this time utilising a SQLite Zstandard database for data compression within it.
Watch out! You're reading a series of articles
- Part 1: Log file compression with Gzip and Zstandard + benchmark
This is the first part of a series of articles diving into log files compression techniques.
- Part 2: Log file compression with SQLite + benchmark
The second part utilizes SQLite as an embeddable storage that not only provides querying capaibilites but also is able to compress the logs itself.
- (currently reading) Part 3: Log file compression with Zstandard VFS in SQLite + benchmark
The third part dives deeper into compression capabilities of SQLite using Zstandard compression algorithm.
- Part 4: Log file compression with Zstandard selective column in SQLite
The fourth part explores database level compression of specific columns within SQLite.
You can find the script that was used to seed the database with data, perform compression and run benchmarks here.