Logdy: Stream logs to a web browser
What is log streaming?
Log streaming is a process of continuously transferring log data from its source to a destination in real-time. Let me explain this concept in more detail:
Log streaming involves:
- Real-time transfer: As log entries are generated, they are immediately sent to the destination.
- Continuous flow: The process is ongoing, not a one-time dump of data.
- Source to destination: Typically, logs are streamed from an application or server (source) to a monitoring tool or storage system (destination).
- Minimal delay: The goal is to make log data available for analysis as quickly as possible after it's generated.
- Live monitoring: It allows for immediate visibility into system behavior, errors, or other events.
In the context of Logdy, which streams logs to a web browser:
- The source could be a remote server, a local development environment, or any system generating logs.
- The destination is a web browser, making the logs easily accessible without needing specialized tools.
- It enables developers or system administrators to monitor logs in real-time through a familiar interface (web browser).
Log streaming is particularly useful for:
- Debugging applications in real-time
- Monitoring system health and performance
- Detecting and responding to issues quickly
Advantages of Browser-Based Log Streaming
Accessibility from Any Device
Universal Access: Browser-based log streaming allows users to access logs from any device with an internet connection and a web browser. This includes desktops, laptops, tablets, and smartphones.
Platform Independence: There’s no need to worry about the operating system or device compatibility. Whether users are on Windows, macOS, Linux, Android, or iOS, they can access the logs seamlessly.
Remote Work Enablement: This feature is particularly beneficial for remote teams or for administrators who need to monitor logs while away from their primary workstations. It enables efficient remote troubleshooting and monitoring.
No Need for SSH or Complex Setups
Simplified Access: Users can avoid the complexities associated with setting up SSH (Secure Shell) connections, configuring VPNs (Virtual Private Networks), or dealing with firewalls and other network security configurations.
Reduced Technical Barriers: By eliminating the need for SSH or other technical setups, browser-based log streaming makes log access easier for non-technical users or for team members who may not be familiar with command-line interfaces and network configuration.
Faster Onboarding: New team members or stakeholders can quickly gain access to logs without the need for detailed setup instructions or extensive IT support. This reduces onboarding time and allows users to focus on their primary tasks.
Real-Time Updates
Immediate Insights: Real-time log streaming ensures that users receive updates as they happen, which is critical for monitoring, troubleshooting, and diagnosing issues promptly.
Enhanced Monitoring: For operations teams, real-time updates provide immediate feedback on the system's performance, helping them detect and respond to incidents more quickly.
Event Tracking: Developers and analysts can track specific events or triggers in real-time, enabling faster debugging and analysis of system behaviors or user actions.
Collaboration: Real-time data allows multiple team members to view the same log updates simultaneously, facilitating collaborative troubleshooting and decision-making.
Example 1: Monitoring a Web Application in Production
Scenario
A large e-commerce website uses a browser-based log streaming tool to monitor its production environment. The operations team needs to ensure the website is running smoothly and efficiently, especially during peak shopping times.
Log Streaming in Action
Real-Time Error Detection: As users navigate the website, any errors or exceptions (e.g., 500 Internal Server Errors, database connection issues) are streamed live to the operations team's dashboard. The team can see error messages, stack traces, and affected URLs instantly.
Performance Monitoring: The log streaming tool provides real-time metrics on server response times, API call durations, and user load. Sudden spikes in response times or load can be immediately identified, allowing the team to investigate potential bottlenecks or resource issues.
User Activity Tracking: Logs related to user actions, such as product searches, adding items to the cart, and completing purchases, are monitored. This helps the team understand user behavior and detect any unusual patterns, such as a sudden drop in conversions, which might indicate a problem with the checkout process.
Example 2: Managing a Cloud Infrastructure
Scenario
A company with a cloud-based infrastructure relies on multiple microservices deployed across various cloud providers. The DevOps team uses browser-based log streaming to maintain the health and performance of the entire ecosystem.
Log Streaming in Action
Service Health Monitoring: Each microservice continuously sends health check logs, including status codes, health metrics, and dependency statuses. The DevOps team can see the health status of all services in real-time, allowing them to detect and address issues such as service degradation or outages.
Deployment Tracking: During deployments, real-time logs show the progress and success of each step in the deployment pipeline. If an issue arises during deployment, such as a failed build or a service not starting correctly, the team can quickly identify and resolve it without delay.
Resource Utilization: Logs from various cloud resources (e.g., VMs, containers, databases) provide insights into CPU usage, memory consumption, disk I/O, and network traffic. Real-time monitoring helps the team manage resources efficiently, scaling up or down based on current demand.
Incident Response: When an incident occurs, such as a service outage or performance degradation, the DevOps team uses the log streaming tool to correlate logs from different services and infrastructure components. This correlation helps them quickly identify the root cause of the issue and implement a fix.
Meet Logdy
Logdy is a versatile DevOps tool designed to enhance productivity in the terminal. Operating under the UNIX philosophy, Logdy is a single-binary tool that requires no installations, deployments, or compilations. It works locally, ensuring security, and can be seamlessly integrated into the PATH alongside other familiar commands like grep, awk, sed, and jq. It is particularly beneficial for professionals such as software engineers, game developers, site reliability engineers, sys admins, and data scientists who frequently work with terminal logs or outputs.
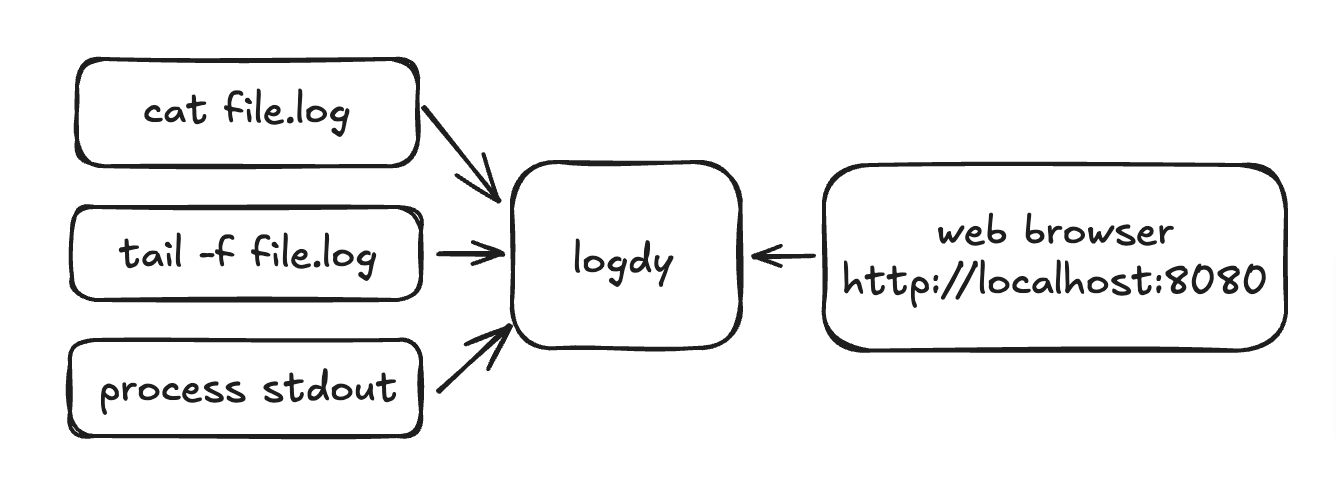
Logdy records the output of processes, whether from standard output or a file and directs it to a web UI. The web UI served on a specific port by Logdy, provides a reactive, low-latency application for browsing and searching through logs. It supports various use cases, such as tailing log files, integrating with applications (e.g., node.js, Python scripts, Go programs, or anything else that produces standard output), and tools like kubectl, docker logs etc.
One notable feature is its hackability with TypeScript, allowing users to filter, parse, and transform log messages by writing TypeScript code directly within the browser. This hackability provides flexibility to express custom logic without delving into the intricacies of other command-line tools. Overall, Logdy offers a convenient and efficient solution for managing and analyzing terminal logs.
Read more about Logdy architecture and it's applications
bash
# use with any shell command
$ tail -f file.log | logdy
Display columns and filters
Logdy makes parsing and column selection a breeze. Use a built in "autogenerate" feature to generate columns based on JSON object present. Then you can make any adjustments and customizations. Based on the columns you can also emit facets or use another great feature to generate those automatically.
With a JSON object in place, you can use Auto-generated columns together with Faceted columns.
Logdy installation
Naviagate to docs for instructions on how to install Logdy. You can download a precompiled library, install using script or homebrew, lastly you can compile Logdy yourself.
Here are a few blog posts that show case a magnitude of Logdy applications: