RabbitMQ logs viewer, setup a Web UI for logging
What is RabbitMQ?
RabbitMQ is an open-source message broker software that implements the Advanced Message Queuing Protocol (AMQP). It acts as an intermediary for messaging, enabling applications to communicate with each other by sending and receiving messages. RabbitMQ is used for building distributed systems, microservices architectures, and for implementing various messaging patterns like publish/subscribe, routing, and remote procedure calls.
How to find RabbitMQ configuration files?
Use the command
$ rabbitmq-diagnostics statusor alternatively you can look at the top of the logs file (/var/log/rabbitmq) where a specific part will be placed:
node           : rabbit@example
home dir       : /var/lib/rabbitmq
config file(s) : /etc/rabbitmq/advanced.config
               : /etc/rabbitmq/rabbitmq.conf
Where RabbitMQ logs are stored?
The location of RabbitMQ logs depends on the installation method and operating system. Generally:
- On Linux systems installed via package managers:
/var/log/rabbitmq/ - On Windows:
%APPDATA%\RabbitMQ\log\ - For generic UNIX builds:
$RABBITMQ_HOME/var/log/rabbitmq/
The exact path can be confirmed in the RabbitMQ configuration file or by checking the RabbitMQ environment variables.
It should be noted that you can configure log in RabbitMQ to be saved to a file or to a console output.
Alternatively you can use a command to find out the logs location:
$ rabbitmq-diagnostics -q log_locationHow to configure logging for RabbitMQ?
Format JSON logging for RabbitMQ
RabbitMQ can produce log messages in JSON format which is a convenient way to browse the entries with 3rd party browsers. To setup JSON logging for RabbitMQ, use the below setting:
log.file.level = info
log.file.formatter = json
RabbitMQ JSON logging to Syslog
RabbitMQ logs can be forwarded to a Syslog server via TCP or UDP. UDP is used by default and requires Syslog service configuration. TLS is also supported.
Syslog output has to be explicitly configured:
log.syslog = true
log.syslog.transport = tcp # udp, tls
log.syslog.protocol = rfc5424
# custom port and host
log.syslog.ip = 10.10.10.10
log.syslog.port = 1514
log.syslog.formatter = json
log.syslog.identity = my_rabbitmq
log.syslog.facility = user
How to rotate RabbitMQ logs?
Built-in Periodic Rotation
# rotate when the file reaches 10 MiB
log.file.rotation.size = 10485760

# keep up to 5 archived log files in addition to the current one
log.file.rotation.count = 5

# archived log files will be compressed
log.file.rotation.compress = true
Built-in File Size-based Rotation
# rotate every night at midnight
log.file.rotation.date = $D0

# keep up to 5 archived log files in addition to the current one
log.file.rotation.count = 5

# archived log files will be compressed
log.file.rotation.compress = true

# rotate every day at 23:00 (11:00 p.m.)
log.file.rotation.date = $D23
By default log rotation is not enabled, you can use either a Logrotate or two built-in mechanisms
Meet Logdy
Logdy is a tool for consuming messy logs and outputting it in a nice Web UI, all with a single command.
$ tail -f /var/log/file.log | logdy
# Enter http://localhost:8080
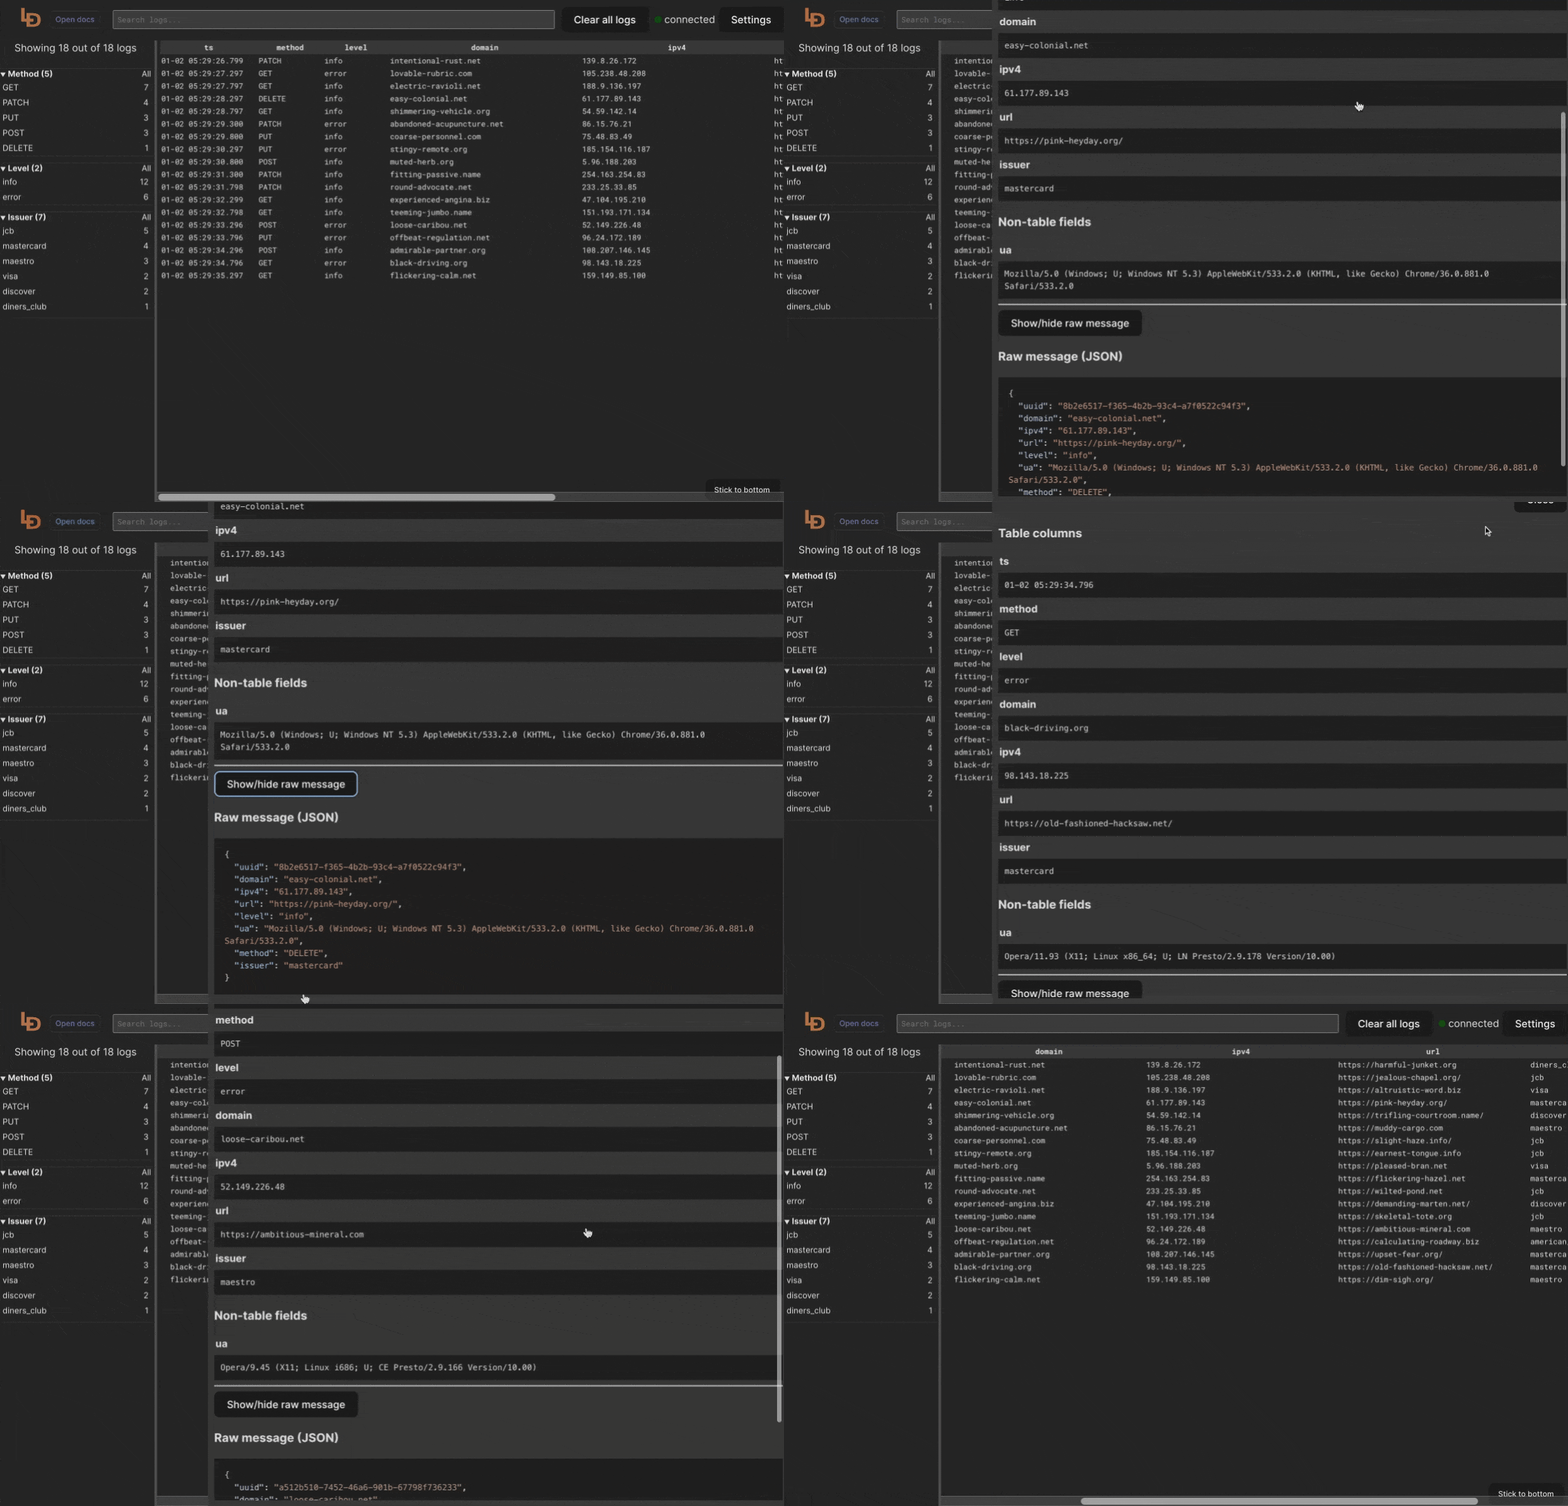
Logdy UI
 If you're interested, read more about Logdy or jump directly to Quick start. You can also see it in action: UI Demo.
Run Logdy with a tail on RabbitMQ logs
# Use -n to specify target node, -N is to specify the number of lines.
$ rabbitmq-diagnostics -n rabbit@target-host log_tail -N 300 | logdy
You can enable continuous stream of logs to be produced as well:
$ rabbitmq-diagnostics -n rabbit@target-host log_tail_streamOnce you know the logs file location you can read those files too:
# Read the whole file into Logdy's buffer
$ cat /var/log/rabbitmq/rabbit.log | logdy

# Follow new additions in the log file
$ tail -f /var/log/rabbitmq/rabbit.log | logdy
That's all, hope you liked it.
Here are a few blog posts that show case a magnitude of Logdy applications:
