How to configure Nginx to produce JSON logs?
If you're wondering how to format Nginx logs as JSON lines it's relatively simple.
Open the NGINX Configuration File
The NGINX configuration file is typically located at /etc/nginx/nginx.conf, but it can vary depending on your setup. You may also find it in /etc/nginx/conf.d/ or /usr/local/nginx/conf/.
$ sudo nano /etc/nginx/nginx.confhttp {
log_format json_combined escape=json '{'
'"time_local":"$time_local",'
'"remote_addr":"$remote_addr",'
'"request":"$request",'
'"status": "$status",'
'"body_bytes_sent":"$body_bytes_sent",'
'"http_referer":"$http_referer",'
'"http_user_agent":"$http_user_agent",'
'"request_time":"$request_time",'
'"upstream_response_time":"$upstream_response_time",'
'"upstream_addr":"$upstream_addr",'
'"upstream_status":"$upstream_status"'
'}';
access_log /var/log/nginx/access.log json_combined;
...
}Explanation:
escape=json: This ensures that special characters in the log values are escaped properly in JSON format.log_format json_combined: This defines a new log format called json_combined.access_log /var/log/nginx/access.log json_combined;: This applies the custom JSON log format to the NGINX access logs.
Reload Nginx
$ sudo systemctl reload nginxYou should now be able to see the JSON lines produced in Nginx logs. Here is an example Nginx JSON log entry:
{
    "time_local":"08/Aug/2024:13:55:36 +0000",
    "remote_addr":"192.168.1.1",
    "request":"GET /index.html HTTP/1.1",
    "status":"200",
    "body_bytes_sent":"612",
    "http_referer":"https://example.com/",
    "http_user_agent":"Mozilla/5.0 (Windows NT 10.0; Win64; x64) AppleWebKit/537.36 (KHTML, like Gecko) Chrome/90.0.4430.93 Safari/537.36",
    "request_time":"0.001",
    "upstream_response_time":"0.001",
    "upstream_addr":"127.0.0.1:8080",
    "upstream_status":"200"
}
Save size in Nginx JSON logs
Since the JSON format in Nginx logs adds a space overhead as the property names are repeated for each line. This can increase the size of the log files, to mitigate this, you can simply compress the names of the fields in a JSON object.
http {
    log_format compressed_json escape=json '{'
        '"ts":"$time_iso8601",'             # timestamp
        '"m":"$request_method",'            # method
        '"u":"$uri",'                       # URI
        '"q":"$query_string",'              # query string
        '"st":$status,'                     # status
        '"ip":"$remote_addr",'              # remote IP address
        '"ua":"$http_user_agent",'          # user agent
        '"rt":$request_time,'               # request time
        '"ur":$upstream_response_time,'     # upstream response time
        '"sz":$body_bytes_sent,'            # body bytes sent
        '"rf":"$http_referer"'              # referrer
    '}';

    access_log /var/log/nginx/access.log compressed_json;
}
Enable compression for Nginx logs when rotating log files
/var/log/nginx/*.log {
    daily
    missingok
    rotate 14
    compress
    delaycompress
    notifempty
    create 640 www-data adm
    sharedscripts
    postrotate
        [ -f /var/run/nginx.pid ] && kill -USR1 `cat /var/run/nginx.pid`
    endscript
}
Stream Nginx logs to Logdy
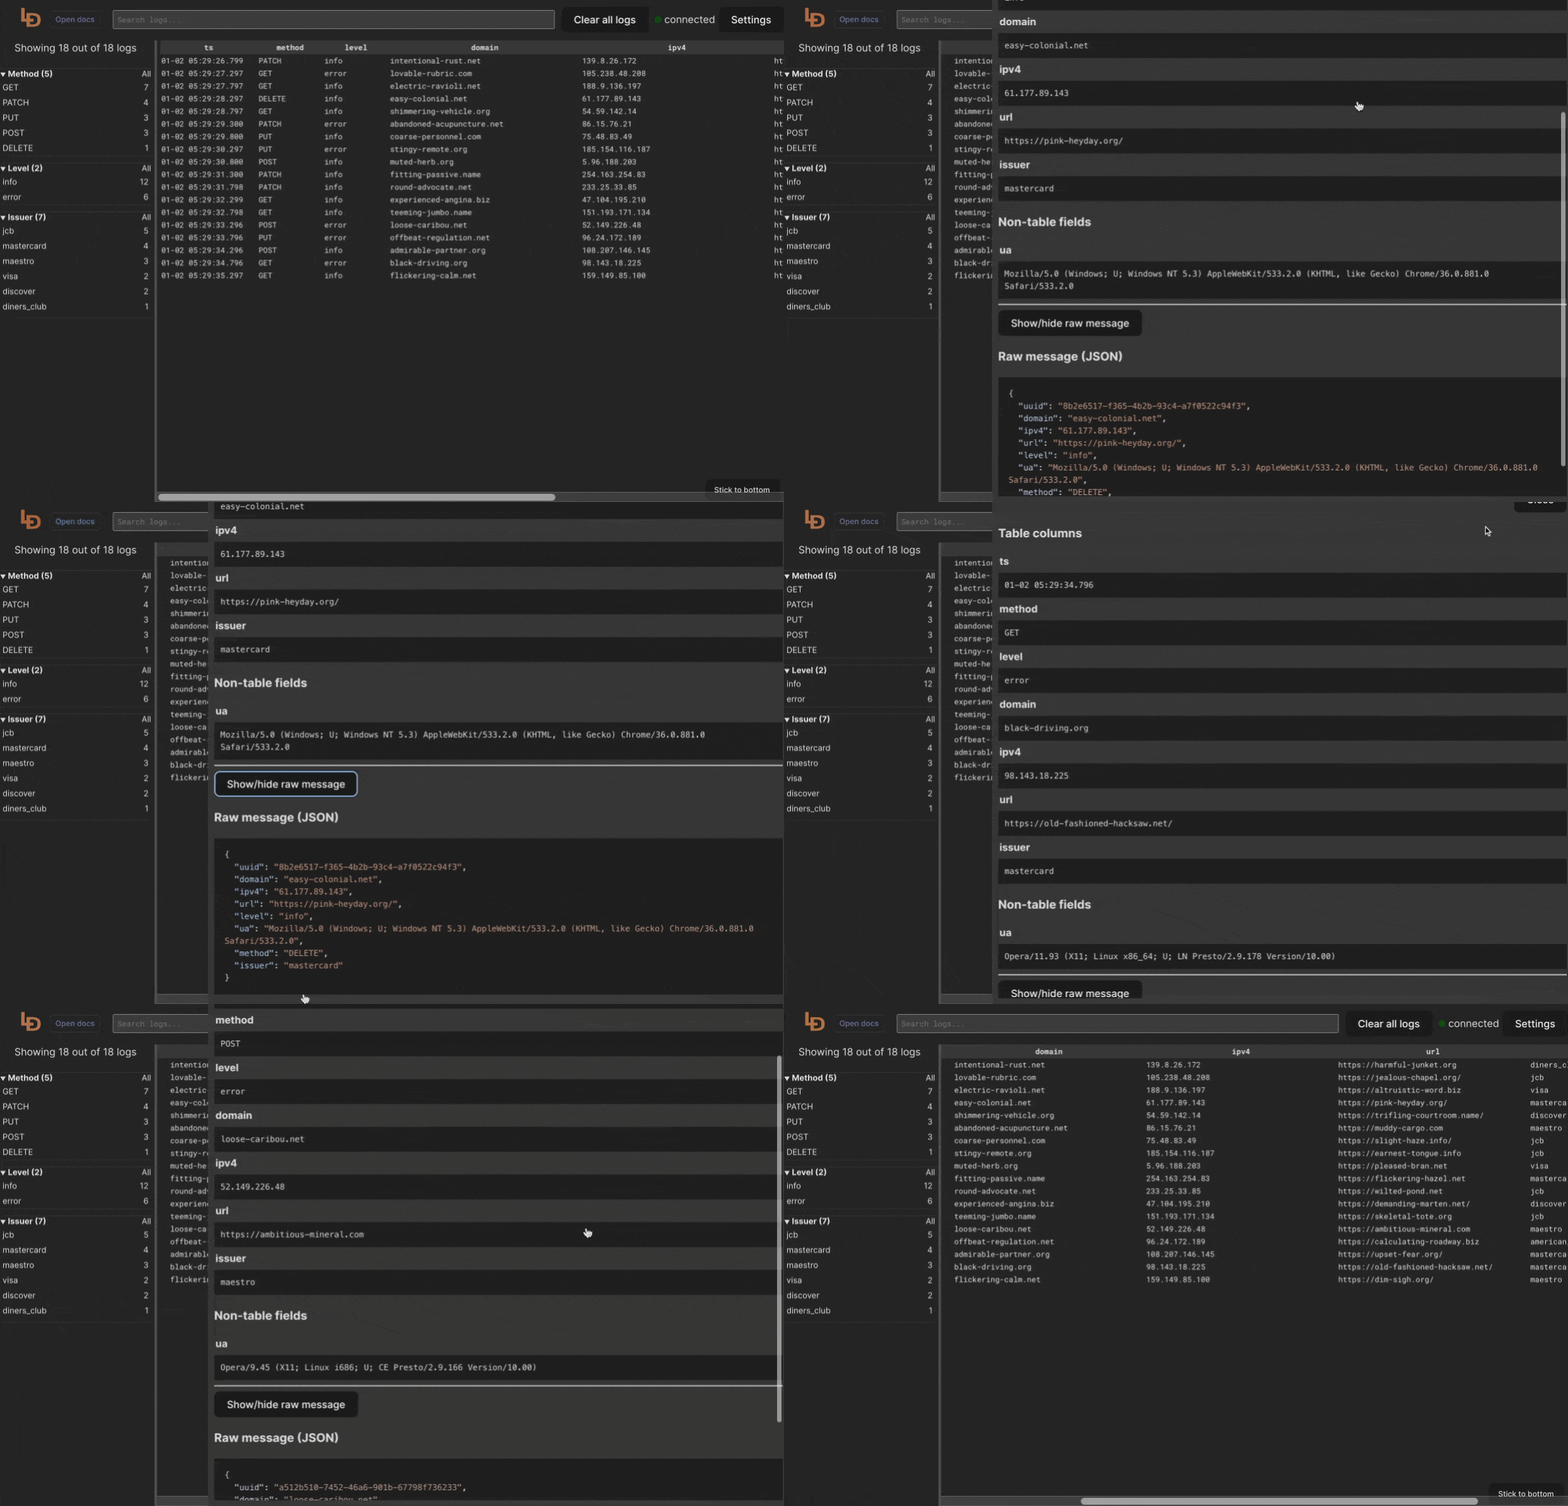
Logdy is a tool for consuming messy logs and outputting it in a nice Web UI, all with a single command.
$ tail -f /var/log/file.log | logdy
# Enter http://localhost:8080
Logdy UI
 If you're interested, read more about Logdy or jump directly to Quick start. You can also see it in action: UI Demo.
On most Linux systems, Nginx will store its logs in /var/log/nginx, however these locations can vary so make sure you're accessing a correct location. Run Logdy (assuming it's added to PATH)
$ tail -f /var/log/nginx/access.log | logdy