Combining PM2 logs from mutliple processes into a single stream
What is PM2?
PM2, also known as Process Manager 2, stands out as a widely adopted process manager for Node.js applications. Its purpose is to streamline the deployment and administration of Node.js applications, facilitating their operation and upkeep in a production setting.
PM2 logs
PM2 collects all of the process output by default and offers a set of commands to allow browsing these logs. However, these commands does not offer a great flexibility, therefore it's relatively hard to find anything relatively quickly without assigning a set of unix tools to work, like grep or awk.
$ pm2 logsThis command presents a unified stream of logs from all processes. Should you wish to inspect the logs for a particular process, you have the option to specify the process name or ID as an argument.
$ pm2 logs your_process_name_or_idReplace your_process_name_or_id with the actual name or process ID of the application you're interested in.
Additionally, you can specify the number of lines to display with the -n option. For example, to display the last 100 lines of logs:
$ pm2 logs -n 100Keep in mind that the logs include both standard output (stdout) and standard error (stderr) streams. If you only want to view one of these streams, you can use the --out or --err options:
$ pm2 logs --out
# or
pm2 logs --err
Why PM2 logs are not great?
PM2 logs can be a bit tricky because they mix regular output and error messages. They don't have fancy search options, and if you're new to it, the interface might seem a bit confusing. Plus, for big applications, using PM2 logs directly could slow things down, so some folks prefer more advanced log tools or third-party solutions for better analysis.
Install using script
The command below will download the latest release and add the executable to your system's PATH. You can also use it to update Logdy.
$ curl https://logdy.dev/install.sh | shDownload reporting
We're tracking the number of downloads by sending an empty request to https://notify.logdy.dev/download which exposes the IP of the machine you're installing Logdy on. If you wish no to do it, use the other install script which skips the reporting.
$ curl https://logdy.dev/install-silent.sh | shInstall with Homebrew (MacOS)
On MacOS you can use homebrew to install Logdy.
$ brew install logdyDownload precompiled binary
Enter release page on Github and select recent release. Download a precompiled binary.
# For Linux (x86)
wget https://github.com/logdyhq/logdy-core/releases/download/v0.17.0/logdy_linux_amd64
# For MacOS (ARM)
wget https://github.com/logdyhq/logdy-core/releases/download/v0.17.0/logdy_darwin_arm64
# Add Logdy to PATH: logdy.dev/docs/how-tos#how-to-add-logdy-to-path
More compliation target
You can find more precompiled libraries on the Github release page. We always always build for the following OS and architecture: linux/amd64 windows/386 windows/amd64 darwin/amd64 darwin/arm64 linux/arm64
Run Logdy with PM2
$ pm2 logs --json | logdyThe command above will route all PM2 logs in a json format to Logdy instance.
Enter Logdy web UI
Visit the address provided in the console output after starting Logdy, by default it should be http://localhost:8080
Display columns and filters
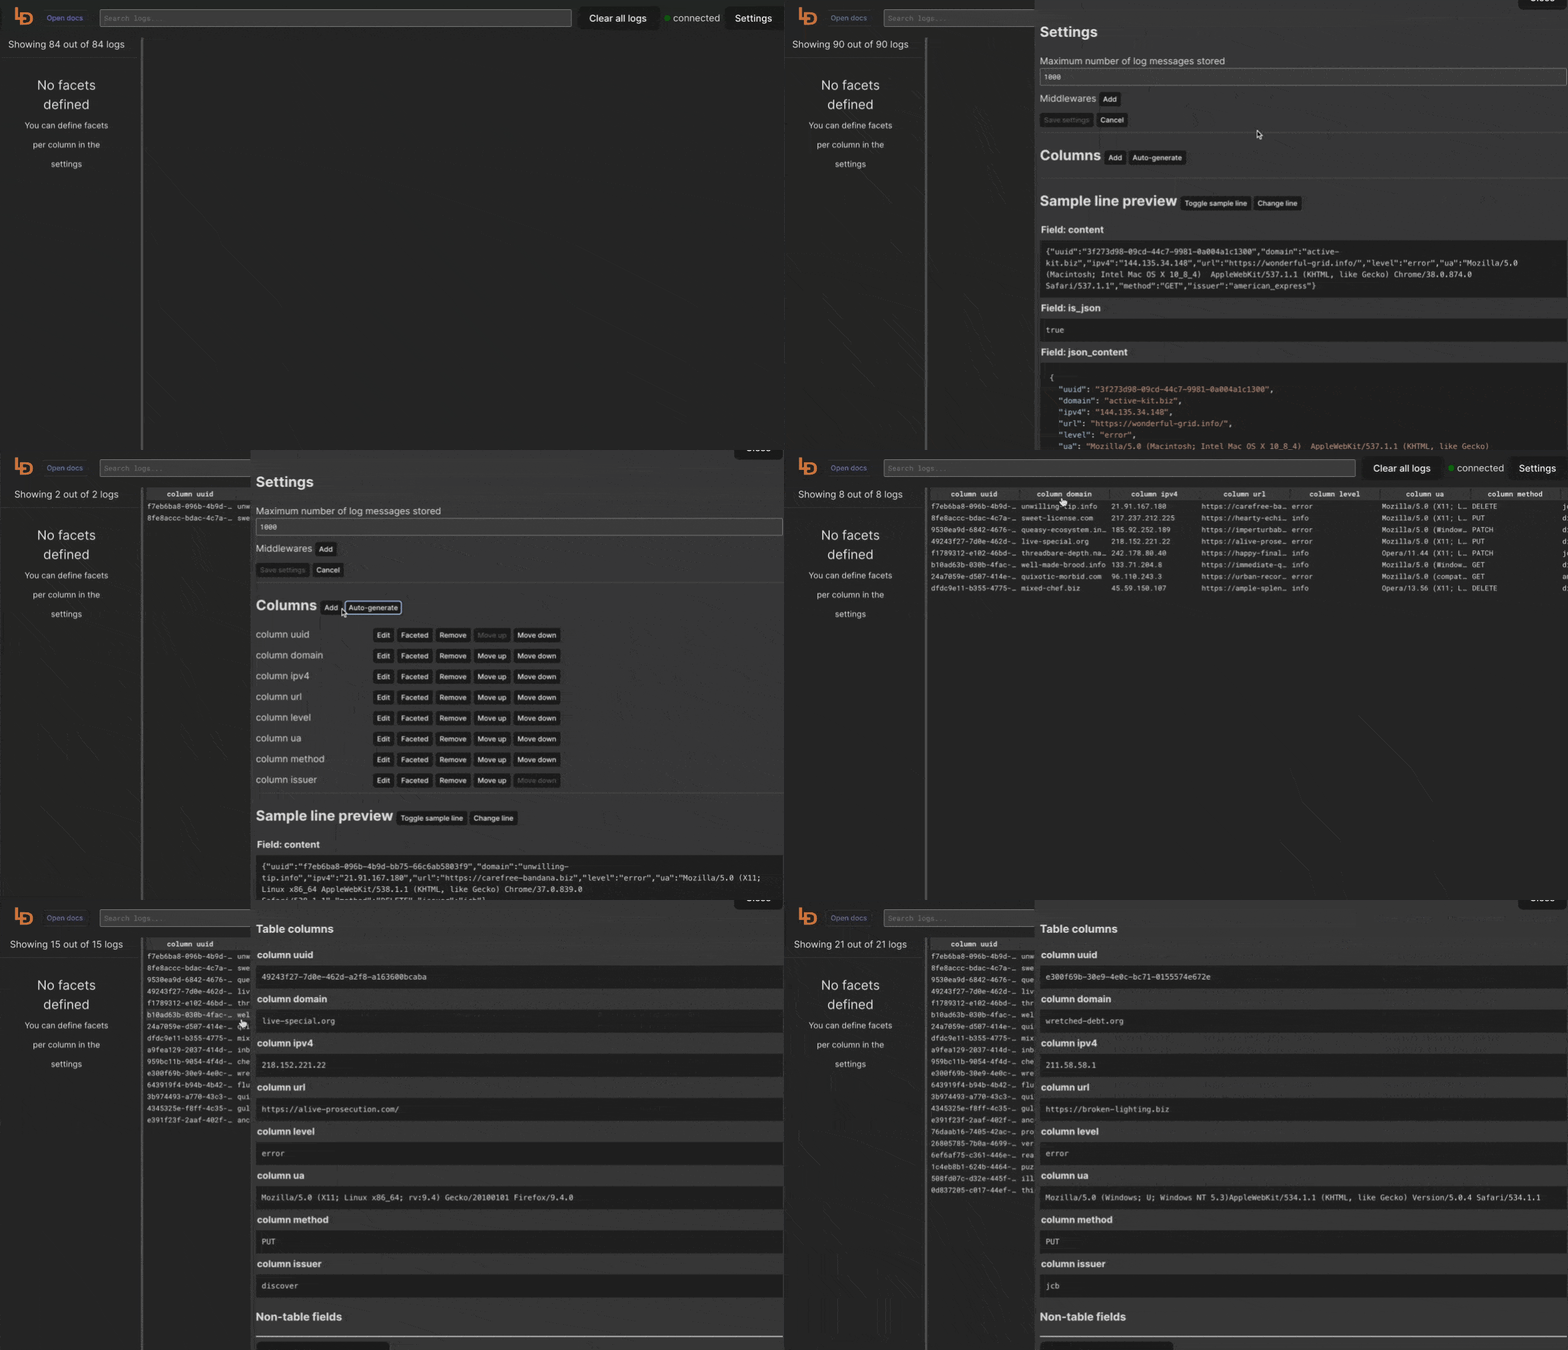
Logdy makes parsing and column selection a breeze. Use a built in "autogenerate" feature to generate columns based on JSON object present. Then you can make any adjustments and customizations. Based on the columns you can also emit facets or use another great feature to generate those automatically.
With a JSON object in place, you can use Auto-generated columns together with Faceted columns.

