Live log tail with Logdy - stream logs from anywhere to web browser
What is live log tailing?
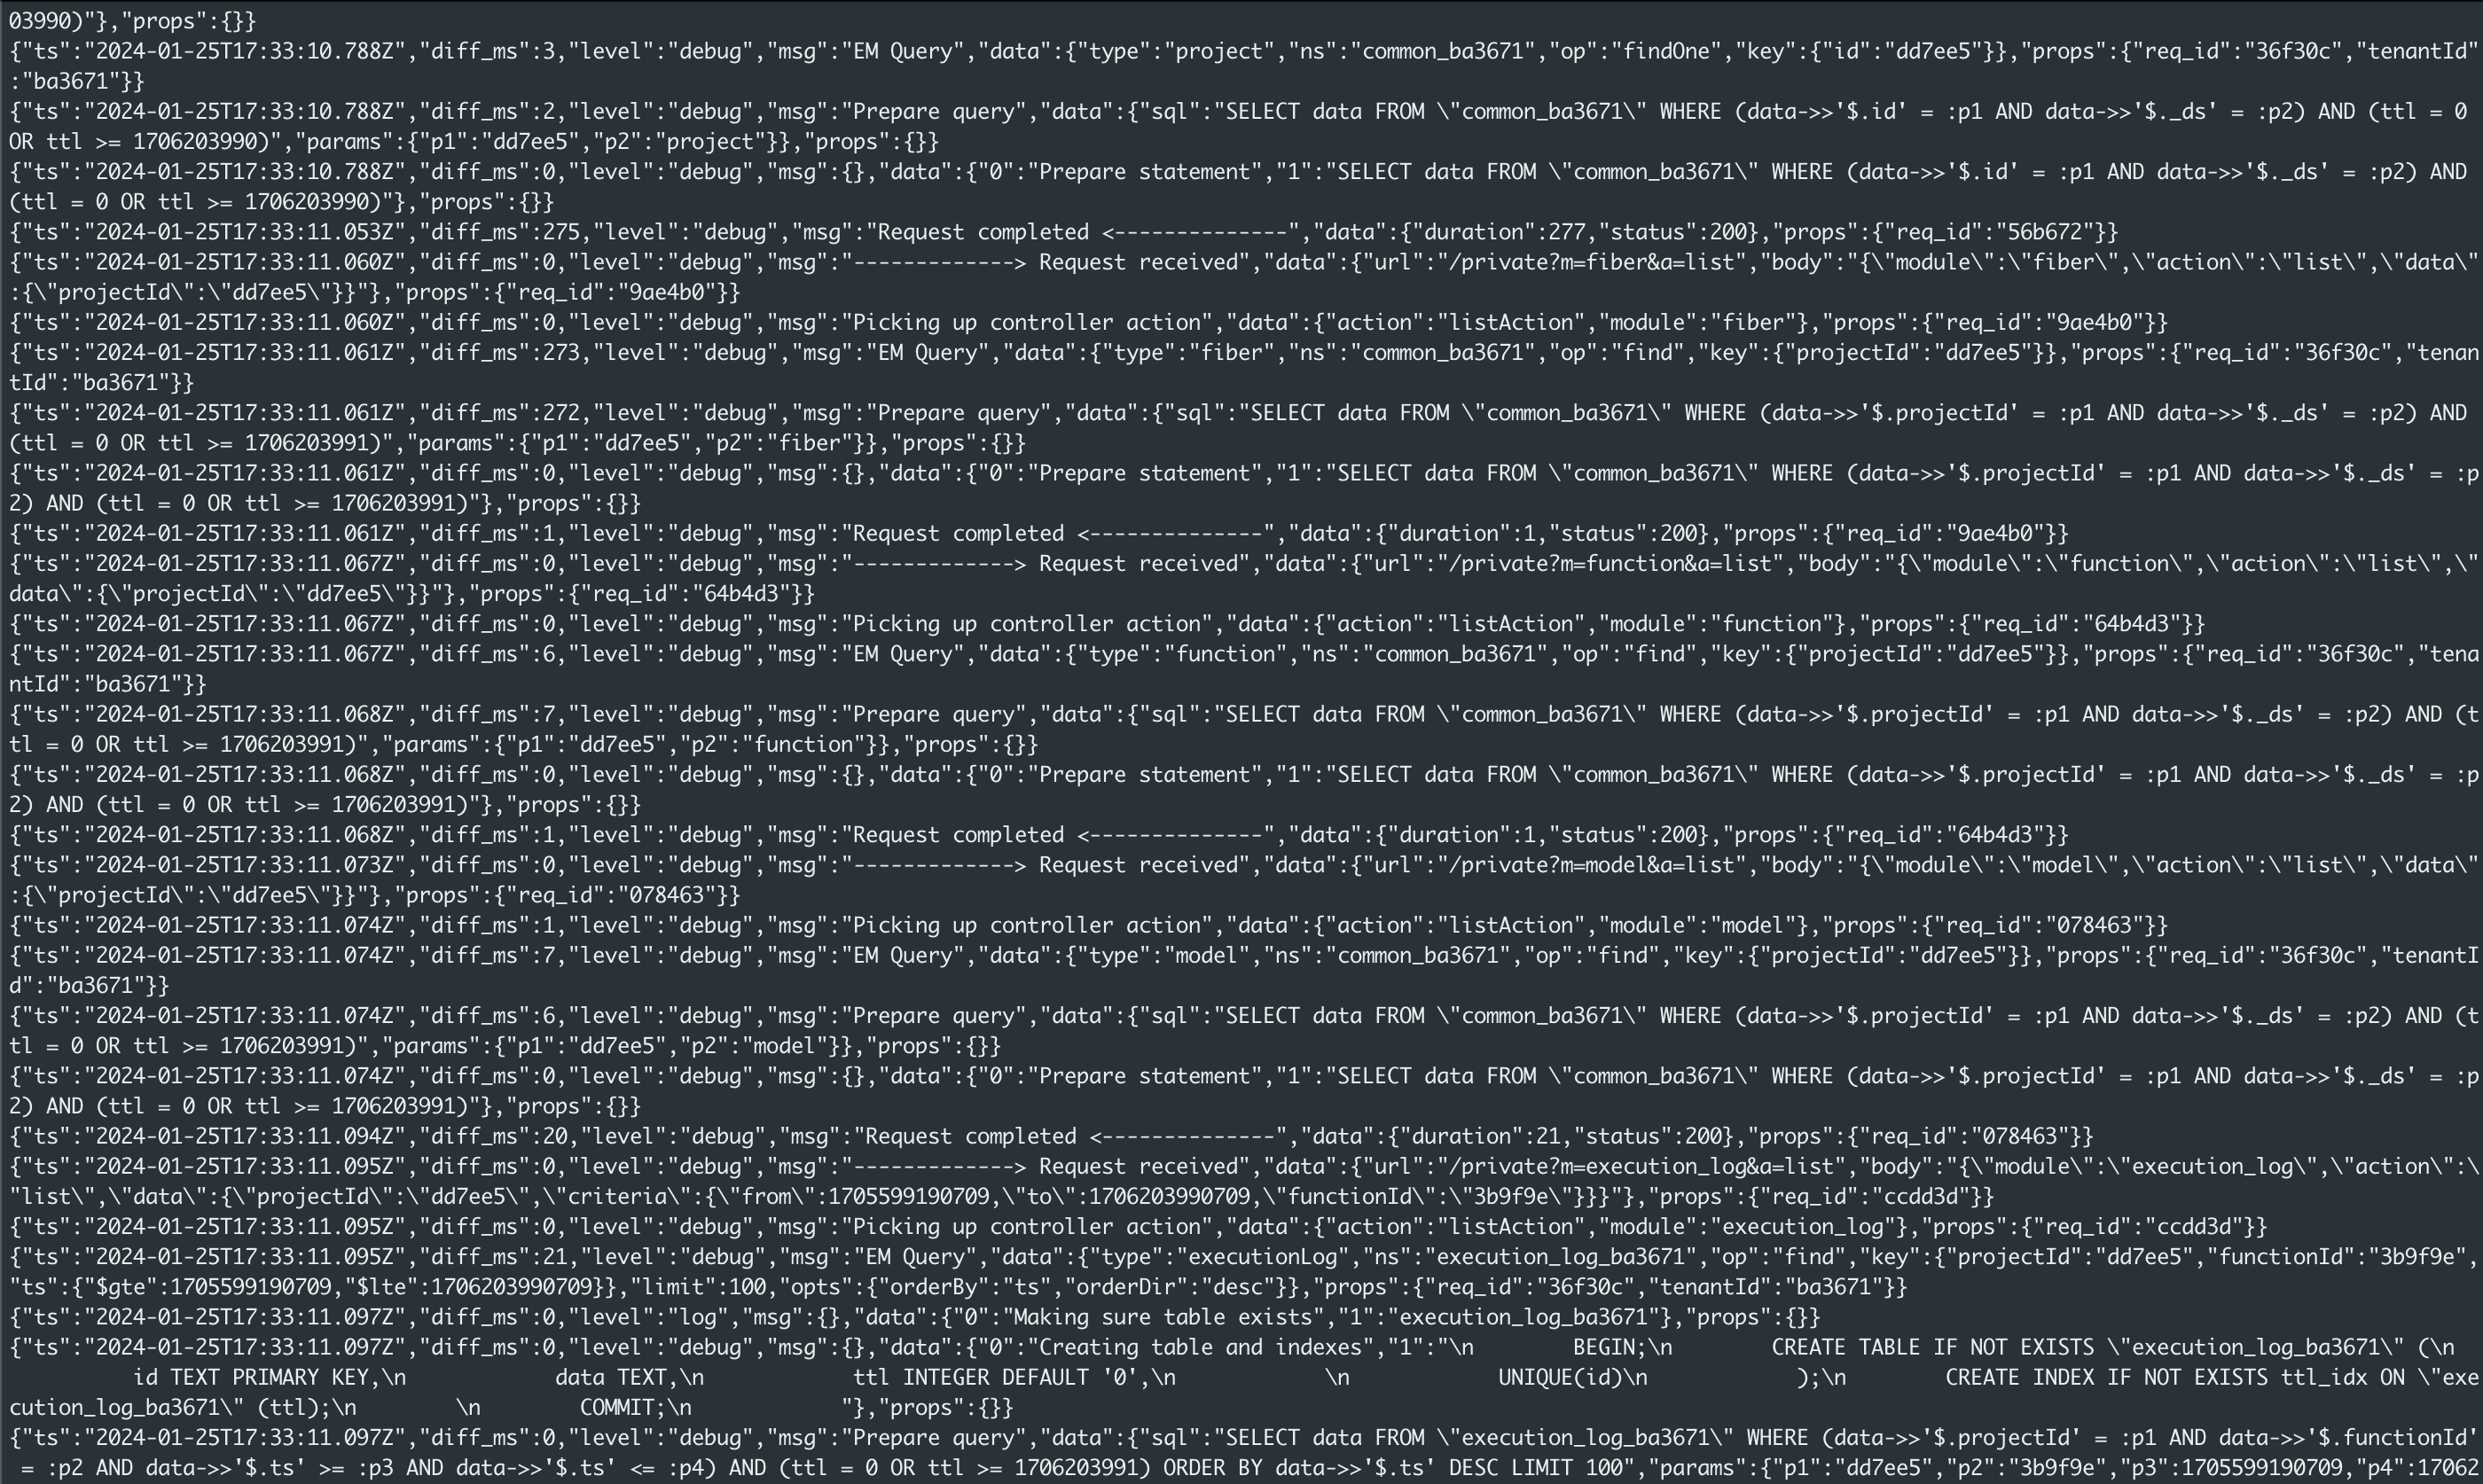
Live log tailing is the process of monitoring continuously and displaying the real-time output of log files as they are being written. It is typically achieved by using the tail command with the -f (follow) option, which continuously displays the last few lines of a log file and updates the output as new lines are added.
bash
$ tail -f /var/log/file.logThe above command is the most common way to follow new log lines appened to a file in real time.
How log tailing can help debug software and IT issues?
Live log tailing is an invaluable tool for debugging software and IT issues because it allows you to monitor the log output in real-time as events occur. This can help you to:
- Quickly identify correlating events. As log messages are generated, you can watch them and quickly identify related events that may all be associated with a specific issue or problem.
- Troubleshoot in real-time. There’s no longer a need to wait for log files to be rotated or to have to analyze historical logs. Live tailing shows you the log output as it is happening, letting you troubleshoot in real time.
- Monitoring of application, server, or systems behavior. Log tailing can provide you insights into how applications, servers, or entire systems may behave and what their various responses to different inputs, workloads, and events are.
- Detect and respond to errors: By monitoring logs in real-time, you can quickly detect and respond to errors, warnings, or other critical events as they occur, potentially preventing more significant issues from arising.
What challenges does log tailing bring?
While log tailing is a powerful tool, it also presents some challenges:
- High log volume: Many applications and systems generate an enormous amount of log data, and it can be hard to keep up with the output and identify relevant log messages.
- Log noise: Log files often contain an abundance of noise or unimportant information, which can drown out important log messages and make it difficult to spot events you should care about.
- Log line formatting: Your applications and systems don't produce log messages according to a single format, and that means it's hard to parse and interpret log messages if each of them looks different on the screen.
- Log distribution: Modern software systems are distributed, and that means that log files are often spread across multiple hosts or services. Tail logs from multiple sources can become a real challenge.
- Performance impact: Continuously tailing large logs or logs from many sources can consume vast amounts of system resources, not to mention the potential for the impact on your application or system.
Should you live tail after deployment?
Live log tailing is a good practice after deploying new software changes or system changes, as you can see if the application or system is behaving in real-time and recognize if anything strange is happening. In saying that, you still need to be aware of the other logs being streamed in and consider if you are receiving too much information. tail -f /path/to/log - Stream the contents of a log file in real-time. If you are dealing with large quantities of logs, running the tail command with a specific time is common. Keep the file open & keep streaming new log data when file is changed. In most cases, live log tailing can be best done for a period after deployment. This way you can see if your system behaves as expected and you can quickly identify critical issues. Once everything works and you're sure nothing terrible happens, you should gradually decrease your live tailing and rely on other logging and monitoring tools, e.g. log aggregation and analysis tools or alerting systems. There are a couple of catches when tailing logs after deployment or a release, mostly the ones mentioned above.
A web-based log-tailing application
A web-based log-tailing application is a software tool that provides a web interface for viewing and monitoring log files in real-time. These applications typically use a combination of server-side components and client-side technologies (such as JavaScript) to continuously stream log data from one or more sources to the user's web browser.
Streaming tail -f to a web interface
One approach to implementing a web-based log-tailing application is to stream the output of the tail -f command (or an equivalent log-tailing utility) to a web interface. This can be achieved by running the tail -f command on the server and piping its output to a server-side process or script that broadcasts the log data to connected web clients using various techniques, such as WebSockets or Server-Sent Events (SSE).
Is it possible to tail the logs I see to a web interface?
Yes, it is possible to tail logs to a web interface using various technologies and approaches. One common method is to use a server-side script mentioned above. The server-side component can be implemented using various programming languages and frameworks, such as Node.js, Python, Ruby, or Java, depending on your preferences and requirements. On the client-side, modern web browsers provide APIs and features that enable real-time data streaming and rendering, such as the WebSocket API or the EventSource interface for handling SSE streams. These can be used in conjunction with JavaScript and front-end frameworks or libraries to build interactive and responsive log-tailing user interfaces.
Logdy - a web-based log tailing interactive
Logdy is a versatile DevOps tool designed to enhance productivity in the terminal. Operating under the UNIX philosophy, Logdy is a single-binary tool that requires no installations, deployments, or compilations. It works locally, ensuring security, and can be seamlessly integrated into the PATH alongside other familiar commands like grep, awk, sed, and jq. It is particularly beneficial for professionals such as software engineers, game developers, site reliability engineers, sys admins, and data scientists who frequently work with terminal logs or outputs.
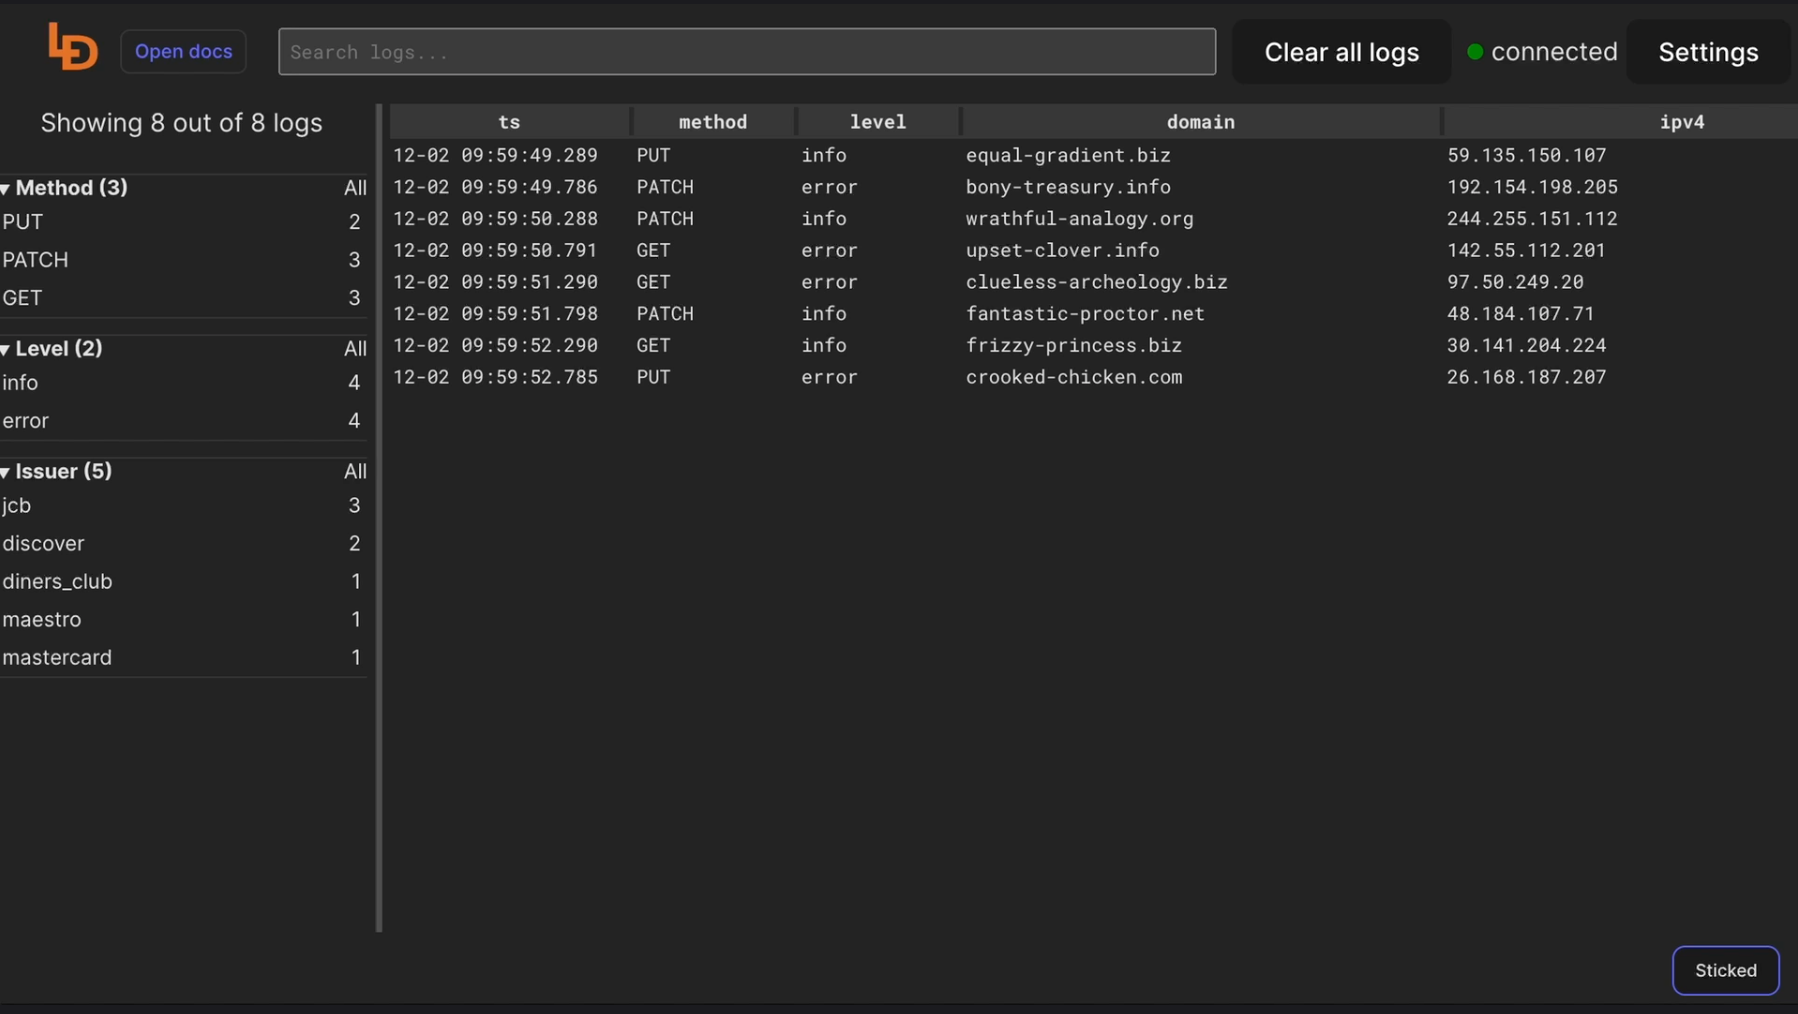
Logdy records the output of processes, whether from standard output or a file and directs it to a web UI. The web UI served on a specific port by Logdy, provides a reactive, low-latency application for browsing and searching through logs. It supports various use cases, such as tailing log files, integrating with applications (e.g., node.js, Python scripts, Go programs, or anything else that produces standard output), and tools like kubectl, docker logs etc.
One notable feature is its hackability with TypeScript, allowing users to filter, parse, and transform log messages by writing TypeScript code directly within the browser. This hackability provides flexibility to express custom logic without delving into the intricacies of other command-line tools. Overall, Logdy offers a convenient and efficient solution for managing and analyzing terminal logs.
Read more about Logdy
GUI for watching logs (tail and grep)
A graphical user interface (GUI) for watching logs, with features like tail and grep, would provide a user-friendly and interactive way to monitor and analyze log files. Such a GUI could be built as a desktop application or a web-based interface, depending on the requirements and target users. It could be used as a simple web UI for viewing syslogs. The GUI could provide the following features:
- Log viewer: A central panel or area for displaying the log contents in real-time, similar to the output of tail -f.
- Log selection: A file browser or dropdown to select the log file(s) to be monitored. Filtering and searching: Tools for filtering the log output based on specific criteria or patterns, akin to grep.
- Highlighting and color-coding: Options to highlight or color-code log entries based on keywords, severity levels, or custom rules.
- Log filtering: The ability to filter log entries based on timestamps, log levels, or custom patterns.
- Log following: A feature to automatically follow and display new log entries as they are written to the file, similar to tail -f.
- Multiple log viewing: The ability to monitor and display multiple log files simultaneously in separate panels or tabs.
- Log bookmarking: A way to bookmark specific log entries or positions for easy reference or navigation.
- Log export: Options to export log data to various formats (e.g., CSV, JSON, text) for further analysis or archiving.
The GUI could be built using various technologies, such as Electron (for cross-platform desktop applications), or web technologies like HTML, CSS, and JavaScript (for web-based interfaces). Existing log monitoring tools and libraries could also be integrated or extended to provide the desired functionality.
ubuntu log viewer Linux tail file continuously tail live logs