Nginx webserver log parser and viewer UI
Install using script
The command below will download the latest release and add the executable to your system's PATH. You can also use it to update Logdy.
$ curl https://logdy.dev/install.sh | shDownload reporting
We're tracking the number of downloads by sending an empty request to https://notify.logdy.dev/download which exposes the IP of the machine you're installing Logdy on. If you wish no to do it, use the other install script which skips the reporting.
$ curl https://logdy.dev/install-silent.sh | shInstall with Homebrew (MacOS)
On MacOS you can use homebrew to install Logdy.
$ brew install logdyDownload precompiled binary
Enter release page on Github and select recent release. Download a precompiled binary.
# For Linux (x86)
wget https://github.com/logdyhq/logdy-core/releases/download/v0.17.0/logdy_linux_amd64
# For MacOS (ARM)
wget https://github.com/logdyhq/logdy-core/releases/download/v0.17.0/logdy_darwin_arm64
# Add Logdy to PATH: logdy.dev/docs/how-tos#how-to-add-logdy-to-path
More compliation target
You can find more precompiled libraries on the Github release page. We always always build for the following OS and architecture: linux/amd64 windows/386 windows/amd64 darwin/amd64 darwin/arm64 linux/arm64
Run Logdy with a tail on Nginx logs
On most Linux systems, Nginx will store its logs in /var/log/nginx, however these locations can vary so make sure you're accessing a correct location. Run Logdy (assuming it's added to PATH)
$ tail -f /var/log/nginx/access.log | logdyEnter Logdy web UI
Visit the address provided in the console output after starting Logdy, by default it should be http://localhost:8080
Build a custom parser for Nginx logs
Let's take a look at the following Nginx access log line
20.191.45.212 - - [15/Jan/2024:22:43:50 +0100] "GET / HTTP/1.1" 200 8665 "https://logdy.dev/" "Mozilla/5.0 (Windows NT 10.0; Win64; x64) AppleWebKit/537.36 (KHTML, like Gecko) Chrome/121.0.0.0 Safari/537.36"The above format can be translated to a Regex expression that will nicely parse that line. Setting it as a middleware will convert all incoming log lines into JSON objects that later can be used to present in the table as columns.
(line: Message): Message | void => {

    const logPattern = /^(\S+) (\S+) (\S+) \[([^\]]+)\] "(\S+) (\S+) (\S+)" (\d+) (\d+) "([^"]+)" "([^"]+)"$/;
    const logMatches = line.content.match(logPattern);

    if (logMatches) {
        line.is_json = true
        line.json_content = {
            ip: logMatches[1],
            dash1: logMatches[2],
            dash2: logMatches[3],
            timestamp: logMatches[4],
            method: logMatches[5],
            path: logMatches[6],
            protocol: logMatches[7],
            status: parseInt(logMatches[8]),
            bytesSent: parseInt(logMatches[9]),
            referer: logMatches[10],
            userAgent: logMatches[11],
        };
    }

    return line;
}
Display columns and filters
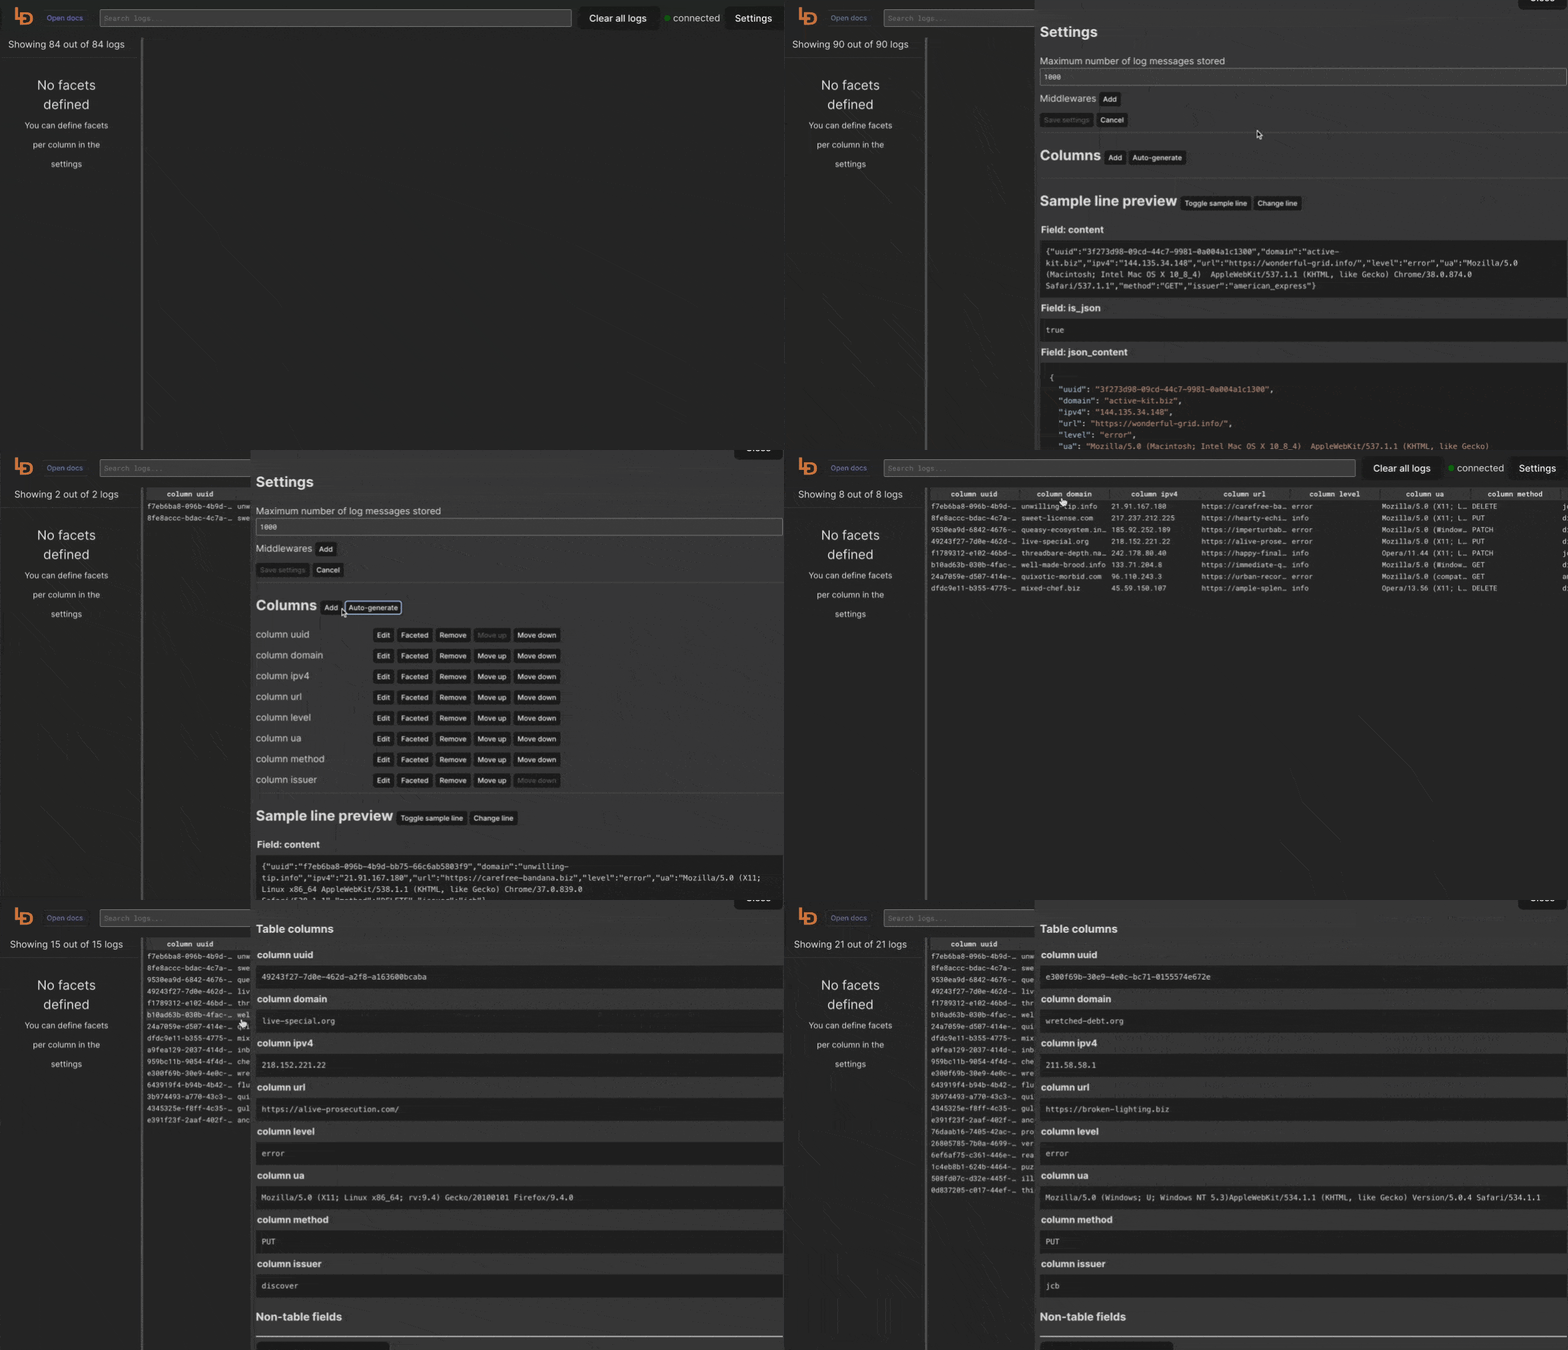
Logdy makes parsing and column selection a breeze. Use a built in "autogenerate" feature to generate columns based on JSON object present. Then you can make any adjustments and customizations. Based on the columns you can also emit facets or use another great feature to generate those automatically.
With a JSON object in place, you can use Auto-generated columns together with Faceted columns.

