PM2 log viewer and web UI
In this blog post you will learn how to use Logdy to browse PM2 processess logs.
What is PM2?
PM2 (Process Manager 2) is a production-grade process manager for Node.js applications. It is designed to simplify the deployment and management of Node.js applications in production environments. PM2 provides features such as automatic application restarts, load balancing, log management, and a comprehensive command-line interface, making it easier to maintain the availability and reliability of Node.js applications in a production setting.
What's good about PM2?
Many developers use PM2 to run applications on production. What's more important, PM2 handles logging and provides pm2 logs command. However, PM2 is missing a built in logs browsing capabilities, which makes it hard to browse and search through these logs.
Install using script
The command below will download the latest release and add the executable to your system's PATH. You can also use it to update Logdy.
$ curl https://logdy.dev/install.sh | shInstall with Homebrew (MacOS)
On MacOS you can use homebrew to install Logdy.
$ brew install logdyDownload precompiled binary
Enter release page on Github and select recent release. Download a precompiled binary.
# For Linux (x86)
wget https://github.com/logdyhq/logdy-core/releases/download/v0.11.0/logdy_linux_amd64
# For MacOS (ARM)
wget https://github.com/logdyhq/logdy-core/releases/download/v0.11.0/logdy_darwin_arm64
# Add Logdy to PATH: logdy.dev/docs/how-tos#how-to-add-logdy-to-path
More compliation target
You can find more precompiled libraries on the Github release page. We always always build for the following OS and architecture: linux/amd64 windows/386 windows/amd64 darwin/amd64 darwin/arm64 linux/arm64
Run Logdy with a PM2 command
PM2 has a built in command pm2 logs [id|name] that works like tail -f, the logs of a selected process are presented in the console. However for our use case we can do even better and leverage --json flag of pm2 logs to present a json output.
{
    "message":"message content here, could be JSON format",
    "timestamp":"2024-01-10T19:30:56.859Z",
    "type":"out",
    "process_id":1,
    "app_name":"app_process"
}
Assuming that the app_process is already running, we can attach to its logs by simply running pm2 logs app_process. To leverage all of the goodies Logdy provides, run the following command. This command will create a web ui for PM2 process:
$ pm2 logs app_process --json | logdyThe above will start Logdy process that catches both STDOUT/STDERR of the pm2 logs app_process --json and forwards it to the Web UI.
Sign up for updates about latest features in Logdy
It's a double opt-in, you'll receive a link to confirm subscription. We will only send you Logdy product updatesEnter Logdy web UI
Visit the address provided in the console output after starting Logdy, by default it should be http://localhost:8080
Display columns and filters
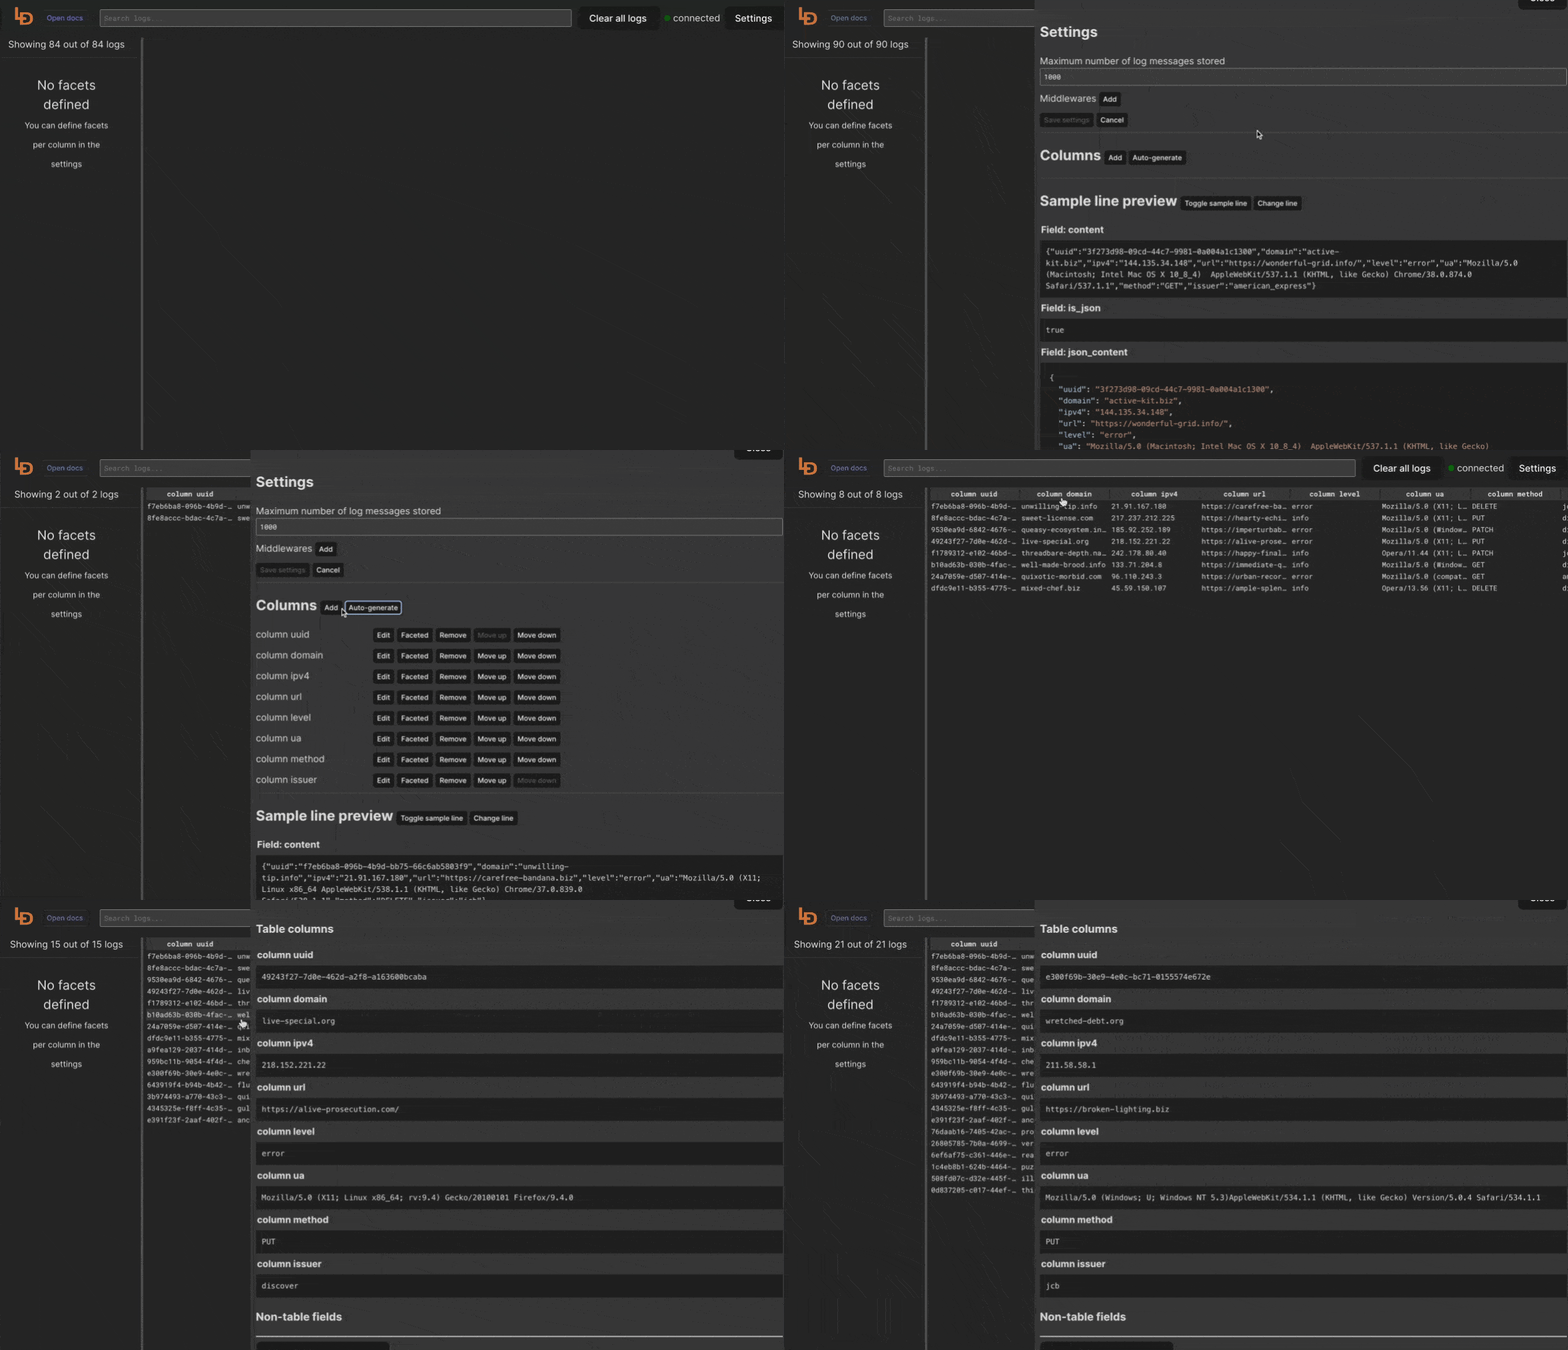
Logdy makes parsing and column selection a breeze. Use a built in "autogenerate" feature to generate columns based on JSON object present. Then you can make any adjustments and customizations. Based on the columns you can also emit facets or use another great feature to generate those automatically.
With a JSON object in place, you can use Auto-generated columns together with Faceted columns.

PM2 how to see logs?
By default PM2 saves logs to $HOME/.pm2/logs/XXX-err.log, where XXX is your PM2 app name
PM2 tail logs in a web UI
Simply just invoke pm2 logs X command where X is the process ID or name and PM2 will follow new lines added to the file.
 Logdy
Logdy