Traces
This feature is supported since version 0.10.0
WARNING
In order to display the traces, you must fill the Correlation IDs
Activation
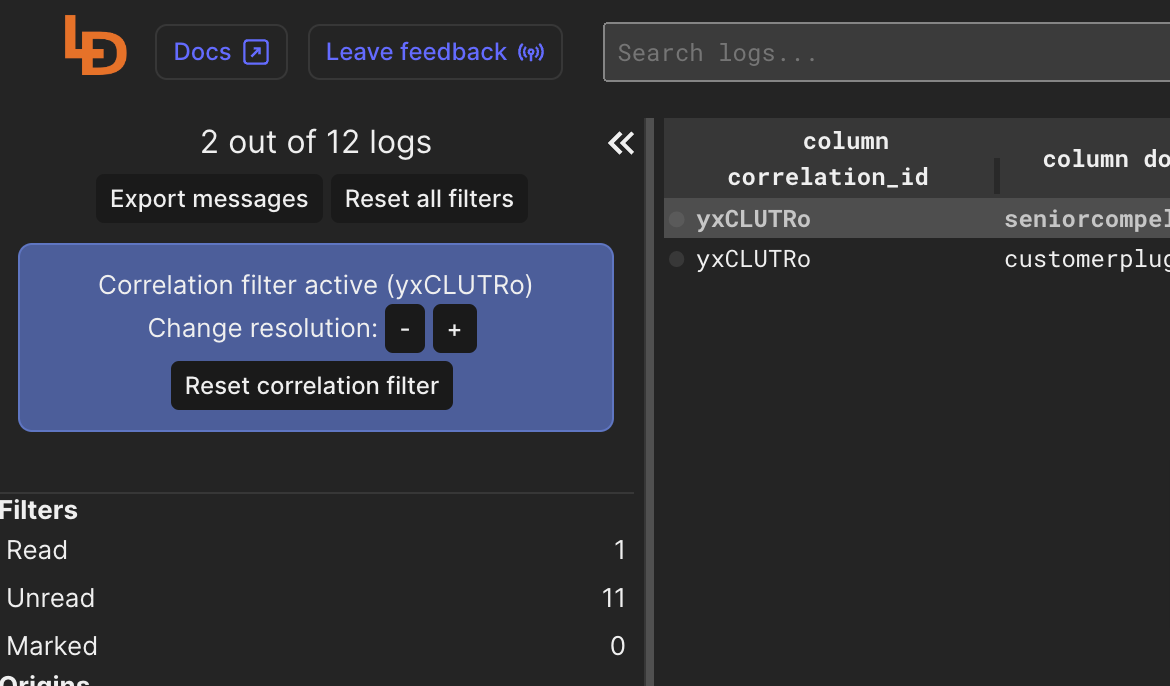
Traces visualization in Logdy allows for easy review of the correlated events on a graphical timeline. The view is activated once you filter Correlated events.
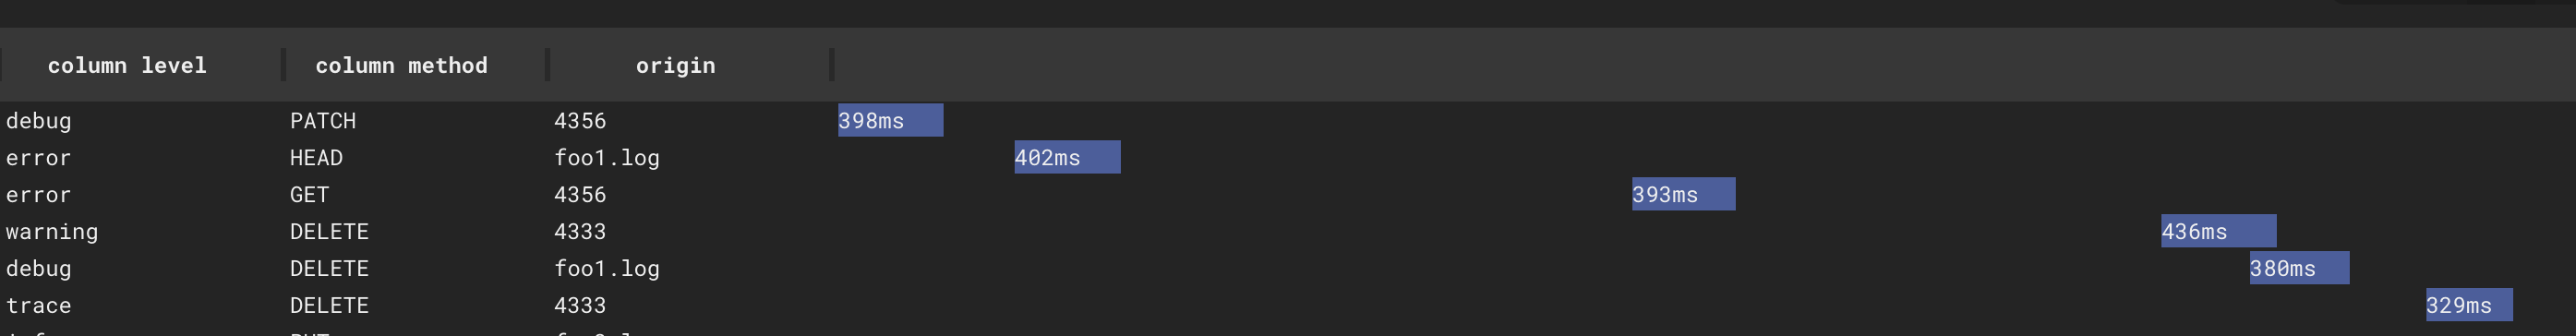
An additional column will be added to the logs tables. Each line will be represented by a block on a timeline. The timeline is created based on relative values derived from the first and last log messages. The width of the block is represented by the duration, which is also relative.
You can change the relative width of the whole timeline along with block's width by changing the resolution.
Trace metadata
To properly draw a timeline, Logdy requires a few data points to be provided with every log message (refer to Code reference).
startof the event. This should be a positive number, there are no requirements regarding the unit, it could be seconds, milliseconds, etc.durationprovided as an absolute number orend(unit similar asstart) provided as a number relative tostart(which meansstart < end). The unit ofdurationis also arbitrary.- optionally a
labelthat will determine the content displayed within a block.
TIP
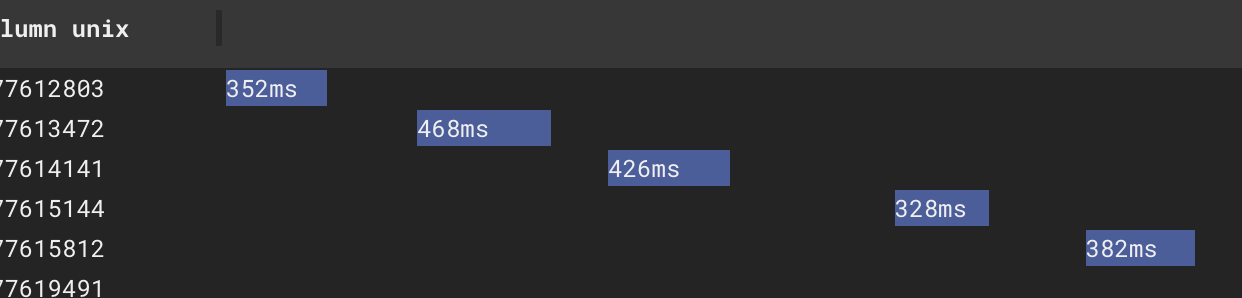
When drawing a timeline of traces, Logdy will compare the difference between start values of the first and last log message. That absolute number will be fit on the screen no matter how big or small. Similar with the duration the number will be relative the width of the whole timeline.
Below is an example of the timing object setup in a middleware.
ts
(line: Message): Message | void => {
    line.timing = {
        start: parseInt(line.json_content.unix),
        duration: parseInt(line.json_content.duration),
        label: `${line.json_content.duration}ms`,
    }
    line.correlation_id = line.json_content.correlation_id
    return line;
}
Example trace
Styling trace blocks
Additionally, you can supply some styles to each trace block. By default, trace blocks will have the same color and border, however, you can customize it by providing a style property in a timing object. This way, depending on the log line you can change their appearance.
ts
(line: Message): Message | void => {
    line.timing = {
        start: parseInt(line.json_content.unix),
        duration: parseInt(line.json_content.duration),
        label: `${line.json_content.duration}ms`,
        style: {
            backgroundColor: "#fe7f2d",
            border: "1px solid #fcca46",
            color: "#233d4d"
        }
    }
    line.correlation_id = line.json_content.correlation_id
    return line;
}